


The rise of social media in recent years has been matched by a surge in research to study human behavior that utilizes the data produced by social media users. This data can provide insights on a wide range of topics, from how grassroots and political campaigns are organized to how people manage their health and wellness. The area of research called crisis informatics looks to understand how people use personal information and communication technology, including social media, to respond to disaster in innovative ways and to cope with uncertainty.1Leysia Palen and Kenneth M. Anderson, “Crisis Informatics—New Data for Extraordinary Times,” Science 353, no. 6296 (2016): 224–225. As spaces where victims of disasters, global onlookers, digital volunteers, government officials and organizations, and emergency responders participate, social media platforms offer a way for researchers to learn about human behavior and disaster response, given thoughtful collection and treatment of the data.
Responses to the multiplicity of uncertainty
Crisis informatics draws upon the wider, multidisciplinary field of human-computer interaction (HCI), which studies the relationship between people and information technology and the design of such technology. The study of uncertainty in HCI involves technologically mediated communication of uncertain information, as well as how people interpret and make sense of it. These manifest in many different domains and applications in HCI, including analysis of uncertain data, visualization of personal health or sensor data, information sharing and rumors related to crisis events, and interpretation of weather forecasts, to name a few. In HCI, and relatedly in information visualization, presenting uncertainty is beneficial in that it promotes trust and aids in people’s decision-making.2Miriam Greis et al., “Uncertainty Visualization Influences How Humans Aggregate Discrepant Information” (conference paper, ACM CHI Conference on Human Factors in Computing Systems, Montreal, QC, April 2018).
In the context of hazardous weather, such as hurricanes, uncertainty exists in multiple forms. As soon as a hurricane develops, and all the way through its dissipation, forecasts and other risk information are produced and shared with the public. This information is itself uncertain from a meteorological standpoint, as many hurricane forecasts are probabilistic rather than deterministic and because hurricanes are rapidly evolving natural phenomena. Uncertainty is also an important factor when representing this information to a wider audience, especially to the general public. For visual representations—hurricane forecast and risk imagery—cognitive research on people’s interpretations has mainly been conducted in the laboratory and via surveys.3→Lace M. Padilla, Ian T. Ruginski, and Sarah H. Creem-Regehr, “Effects of Ensemble and Summary Displays on Interpretations of Geospatial Uncertainty Data,” Cognitive Research: Principles and Implications 2, no. 1 (2017): 40.
→Ian T. Ruginski et al., “Nonexpert Interpretations of Hurricane Forecast Uncertainty Visualizations,” Spatial Cognition & Computation 16, no. 2 (2016): 154–172.
In addition to these meteorological and cognitive perspectives of uncertainty around hazardous weather, uncertainty can also be socially constructed, especially in response to risk information. In a hazardous weather event, people receive official information about risks and, depending on the event, recommendations or even mandates about what preparatory actions to take, such as evacuation. However, we know that people do not passively receive such information and then decide what to do.
“Even an official evacuation order can thus be uncertain, despite its seemingly objective nature, as people may have conflicting reasons why they do not or cannot evacuate.”The information communication system around hazardous events is both dynamic and social, with experts and members of the public both actively engaged.4Rebecca E. Morss, Julie L. Demuth, and Jeffrey K. Lazo, “Communicating Uncertainty in Weather Forecasts: A Survey of the US Public,” Weather and Forecasting 23, no. 5 (2008): 974–991. Further, people consider many interconnected factors when making decisions around hazardous weather, including their interpretations of expert information, but also the ability of their family/household to evacuate, the tradeoffs and risks with evacuating versus sheltering in place, the decisions of friends and others in their neighborhood, or their experiences in past hurricanes or disasters. These combined factors can create uncertainty for an individual trying to understand and act on risk information around hazardous weather. Even an official evacuation order can thus be uncertain, despite its seemingly objective nature, as people may have conflicting reasons why they do not or cannot evacuate. For instance, an NPR article outlined reasons why people do not evacuate during a hurricane: the financial expense, the potential boost in income from staying to work in the affected area to repair and clean up, “anchors and tethers” such as pets or elderly relatives, fear based on risk information presented without recommended actions, and a lack of ability to evacuate based on location or situation. These reasons are often expressed on social media, as well.
In a study related to the 2012 Hurricane Sandy,5T. Jennings Anderson et al., “Far Far Away in Far Rockaway: Responses to Risks and Impacts during Hurricane Sandy through First-Person Social Media Narratives” (conference paper, 13th International Conference on Information Systems for Crisis Response and Management—ISCRAM ‘16, Rio de Janeiro, Brazil, May 2016). one user who thoroughly documented his experience of the event on Twitter noted that he was under an evacuation order in New York City but explained why he did not evacuate:
Why we didn’t leave: 6 animals, one with special needs, could not take to shelter. Was told specifically we would be robbed if we left.
Though a person’s risk perception influences whether they decide to evacuate or take other protective actions, this perception is localized and contextualized for each individual. Regardless of the level of certainty in information presented about risk, people will almost always construct and experience uncertainty when taking into consideration their many personal factors and perspectives, and often in ways that are unforeseen by those communicating the risk information.
Tweeting through uncertainty
My approach to identifying and studying uncertainty around hurricane risk information is bottom-up, driven by people and the data they produce. This is distinct from top-down approaches, such as applying a theory or preconceived hypothesis to analyze and understand how people make sense of risk information, or modeling risk according to quantifiable variables. Rather, I use behavioral data to understand risk and uncertainty from people’s lived experiences of hazardous weather, specifically hurricanes. My primary data source is Twitter, a social media platform that is widely used by experts and laypeople alike for communication around crises, including forecast and risk information for hurricanes. Though tweets do not necessarily, or even typically, reflect a complete record of a person’s thoughts, decisions, and actions, this kind of behavioral trace data is valuable because it is as close to in vivo, or taking place in real life, as we can obtain for individuals during crisis events. Through this approach, researchers in HCI and information science rely not on what a person says they would do during a hypothetical disaster, nor on what one remembers they did in a past real disaster, which is done in an experimental lab setting or in a survey; instead, this approach is based on what people actually do—as they report it on Twitter—in real time, in a real event.
However, Twitter data does not magically provide insights about people for a specific topic such as uncertainty. Using this platform for this kind of research requires a thoughtful methodological approach. To understand how people make sense of uncertain information around a particular event, the research does not just collect and analyze every tweet posted in relation to that event. For one, this would return hundreds of millions of tweets, a scale at which only quantitative analysis could be applied, limiting meaningful sociobehavioral insights. Additionally, many if not most of these tweets would have nothing to do with uncertainty and risk, as this is only one topic out of many that people experience and then report on Twitter.
“The initial tweets are treated as ‘sites of interaction’ in which people…can interact with the authoritative source as well as each other to react to, interpret, and make sense of the risk images both individually and collaboratively.”To gain meaningful insights about how people experience and make sense of uncertainty around hurricanes, I use a human-centered data science approach. This involves (1) collecting contextual data, (2) applying context-sensitive methods, and (3) iterating between the micro scale of individual activity and the macro scale of social dynamics.6Marina Kogan, “Emergent Forms of Online Sociality in Disasters Arising from Natural Hazards,” PhD diss. (University of Colorado, Boulder, 2017). Motivated by this approach, I implemented a research agenda based on a dataset of tweets during the 2017 Atlantic hurricane season.7Melissa Bica et al., “Communicating Hurricane Risks: Multi-Method Examination of Risk Imagery Diffusion” (conference paper, ACM CHI Conference on Human Factors in Computing Systems, Glasgow, Scotland, May 2019). Specifically, these tweets contain visual representations (images) portraying hurricane forecasts and risks—e.g., the cone of uncertainty, radar imagery, and spaghetti plots (figures 1 to 3, respectively)—and are disseminated by authoritative sources (weather agencies, meteorologists, emergency managers, etc.) to ensure they contain reliable scientific representations. The data collection also includes associated contextual data, including all the retweets, quote tweets, and replies attached to these authoritative-sourced risk image tweets. Thus, the initial tweets are treated as “sites of interaction” in which people—including members of the public and other experts—can interact with the authoritative source as well as each other to react to, interpret, and make sense of the risk images both individually and collaboratively. Using a variety of context-sensitive methods, the research investigates how and why various risk representations diffuse differently on Twitter and how people make sense of a particular type of risk representation portraying uncertainty in hurricanes, the spaghetti plot.
Figure 1. Cone of uncertainty
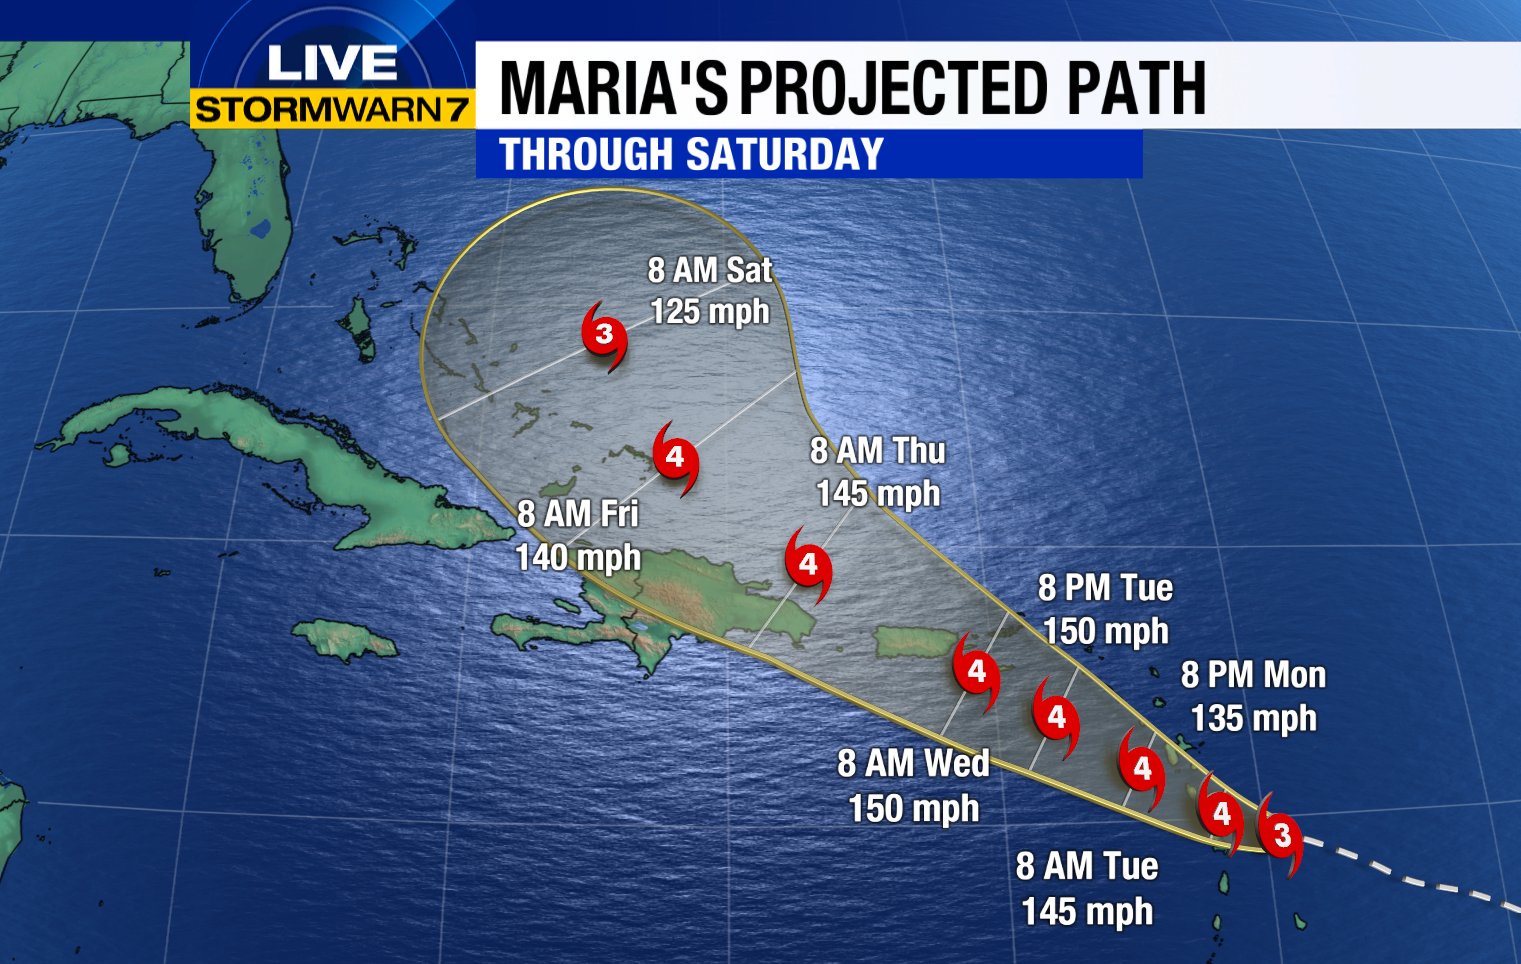
Cone of uncertainty forecast graphic showing the probable track of 2017 Hurricane Maria. Source: ABC7.
Figure 2. Radar image

Radar imagery of 2017 Hurricane Irma. Source: NOAA.
Figure 3. Spaghetti plot

Spaghetti plot showing projected paths from various computer models for 2017 Hurricane Irma. Source: 10News.
Measuring engagement with risk information
First, we used a quantitative approach to study the data at a macro scale to measure the diffusion of various types of hurricane risk image tweets, or how much people engage with them. We thought this would be an indicator of how much people use each type of tweet in their decision-making and risk processing during hurricanes. A seemingly obvious answer might be to measure the “likes” for each tweet, as this indicates people liked something about a tweet. However, “liking” a tweet only reflects a passive engagement—it only shows that a user clicked a heart-shaped button. We wanted to measure more active engagement with tweets that could also provide more context for why someone engaged, so we chose instead to use replies, retweets,8Though retweets reflect a more passive form of engagement than replying or quote-tweeting—both of which entail the user writing additional content—they are still the most common way of measuring diffusion on Twitter. We hope that by including reply and quote tweet diffusion in this research, these forms of engagement will become just as normalized as retweets for future diffusion work, especially because they provide context about the diffusing user beyond the retweet. and quote tweets to measure diffusion. We also were interested in temporal patterns of diffusion, i.e., for how long and how quickly each type of risk image tweet was diffused. These novel diffusion metrics consider the diffusion of information on Twitter contextualized within the rapid and evolving nature of hurricanes themselves.
The diffusion results from this analysis alone do not tell the full story, but instead inform how to conduct subsequent qualitative analyses on the content of the contextual data surrounding different kinds of images, iterating back to the micro scale of individual activity. In particular, this involved analysis of replies and quote tweets. For instance, we found that cone of uncertainty tweets continued to be replied to for a significantly longer amount of time than other categories, so we investigated the long-term replies to these tweets. Many people reply to cone of uncertainty image tweets with questions grounded in managing uncertainty, i.e., questions about the track (“The million dollar question, where does it turn?”), requests for more localized information (“@hurricanetrack chances this moves up to US East Coast?”), and even expert opinions on travel-related risks (“Hey NHC if you had a trip schedule for the BVIs from 9/2–9/8 would you cancel?”), as has been seen in other kinds of crisis events as well.9Xinning Gui et al., “Managing Uncertainty: Using Social Media for Risk Assessment during a Public Health Crisis” (conference paper, ACM CHI Conference on Human Factors in Computing Systems, Denver, CO, May 2017).
Similar questions were found in response to tweets with radar and satellite imagery of hurricanes, but in addition to uncertainty around what the impacts of the hurricane might be, there was uncertainty expressed by “laymen” around how to read or interpret the graphic itself (“Maybe you could explain to us laymen what the various colors mean so we can understand better?”, “Baseline? What does a normal hurricane look like? Asking for those of us with no expertise on the subject.”).
Untangling spaghetti plots
A deeper analysis into one type of forecast image, the spaghetti plot, elaborates upon these high-level findings across many image categories. In a study that is currently underway, we use a technique called discourse analysis to analyze conversations (i.e., replies) around authoritative-sourced spaghetti plot tweets to gain sociobehavioral insights about how users manage uncertainty with this kind of forecast imagery. Spaghetti plot images (similar to figure 3) were chosen for this analysis because they so explicitly portray meteorological uncertainty, and preliminary analyses also revealed that the audience for these images expressed uncertainty about them. Similarly to the other image categories discussed above, people have uncertainty about the spaghetti model as an information representation (“Interesting, Are the colors of the lines based on probability?”, “Are they listed from highest likelihood to lowest on the key?”, “What do the numbers represent on the projected paths?”) and about implications for risks, especially as related to people’s local contexts and situations (“I live in Destin FL. so do I need to worry?”, “I’ve got family in West Palm. I’m advising them to evacuate. That still seem pretty reasonable even given the continued eastward shift?”, “Florida going to get lucky?”)
“Spaghetti plots are themselves unique since they display a range of hurricane track forecasts produced from various computer models rather than a single forecast.”However, there are other responses to spaghetti plot tweets that reflect unique ways of managing and expressing uncertainty as compared to other risk image types. Spaghetti plots are themselves unique since they display a range of hurricane track forecasts produced from various computer models rather than a single forecast. Though, as shown above, not everyone knows what the different “spaghetti” lines in the graphic mean, there is vast content showing that laypeople do understand that probability, and thus uncertainty, are inherent in the spaghetti plot. In tweet replies, this is expressed by people “hoping” for particular outcomes, indicating that they recognize there are more and less desirable outcomes: “Hope they actually get the track of this one right.”, “Hopefully Irma leans to the east”, “Hope it keeps getting pushed to the east.” People also demonstrate recognition of multiple probable outcomes by “voting” and cheering for particular models, as if the models are teams that they support: “Can we all vote to pick the cyan path? That’s how this works right?”, “Let’s go purple and green!”, “C’mon Purple! We’re pulling for you. You got this #Pulling4Purple.” These kinds of replies are typically made in humor—people do not actually believe they have influence over the hurricane forecasts with their supportive tweets—yet also still reflect a recognition of the uncertainty that exists in the hurricane forecast models, as well as the person’s own uncertainty about potential outcomes.
These analyses into how people engage with and make sense of hurricane forecast imagery reveal a variety of forms of uncertainty. Risk communication for hazardous weather should utilize these sorts of findings that are grounded in people’s lived experiences of hurricanes and risk perception. In addition to the meteorological uncertainty inherent in the forecast information, it is important to address the uncertainty that arises when people contextualize the information to their own situations. While from a meteorological point of view it may be important to communicate the multitude of tracks a hurricane may take, for instance, members of the public may just want to know whether they should cancel their Disneyland trip. Uncertainty around hazardous weather and risk representations is not only expressed via questions, but also statements of hope and team-like support, presenting opportunity for risk communicators to address uncertainty in new ways.
References:
→Ian T. Ruginski et al., “Nonexpert Interpretations of Hurricane Forecast Uncertainty Visualizations,” Spatial Cognition & Computation 16, no. 2 (2016): 154–172.

