


What is life expectancy?
Life expectancy is one of the most commonly used measures of health and well-being in societies. Predictions of current and future levels of life expectancy are particularly relevant for agencies like the Social Security Administration and the Centers for Medicare & Medicaid Services. Estimates of what life expectancy will be in the coming years are one among several inputs that determine factors such as the demand for healthcare and many other types of services, the costs of providing these services, and fiscal solvency.
“In actuality, period life expectancy, which is the measure most often reported in the news or policy briefs, is not a prediction or forecast at all—rather, it is a summary measure of mortality conditions at a given point in time.”A common misconception about life expectancy is that it answers the question, “How long will I live?” In actuality, period life expectancy, which is the measure most often reported in the news or policy briefs, is not a prediction or forecast at all—rather, it is a summary measure of mortality conditions at a given point in time. For example, life expectancy at birth in 2020 is the number of years a newborn could expect to live if she experienced the mortality rates observed in 2020 at each age. Compare this to cohort life expectancy, which is the average number of years lived by individuals from a specific birth cohort. In this case, life expectancy for the 1900 birth cohort would be the average age that individuals who were born in 1900 lived to. To calculate cohort life expectancy, we need to wait for all members of that birth cohort to die—typically over a hundred years. The statistic we use most often is period life expectancy, which is an approximation of the age we think recent birth cohorts will live to if there is no future progress in reducing mortality. We usually expect mortality to decline over time, so period life expectancy is typically regarded as an underestimate of cohort life expectancy.
Of course, the world today is far from what we consider normal. That brings us to examining the burden of mortality from coronavirus.
Interpreting mortality rates from coronavirus
Much of the coverage on coronavirus has centered on reporting death counts in order to give a sense of exactly how deadly the disease is. This is an important but fairly complicated endeavor due to reasons that are specific to the case of coronavirus, such as the lack of widespread access to testing, but also due to factors related to the complex nature of mortality that are at play during “normal” conditions.
One of the measures we see reported most often is the percentage of people with coronavirus who die from the disease. While this is sometimes referred to as a mortality rate, it can more accurately be called a case fatality rate, a measure of disease severity often used in epidemiology. To get an accurate case fatality rate, we need to know the number of people who have coronavirus and the number of those people who eventually die from it. Our ability to determine both of these numbers is severely hampered by the lack of testing, and the bias can go in both ways. Under conditions in which testing is not widely available, some individuals are assumed to have coronavirus and are designated as such, even though they were never tested, while other individuals who may not display characteristic symptoms but do have the disease may fail to qualify as candidates for testing. These factors will affect our estimates of who has and who dies from coronavirus.
“There is some variation in how different physicians, medical examiners, and coroners determine what will be listed as the underlying cause of death.”Determining which deaths are counted as coronavirus deaths raises additional complications. In most cases, a death will “count” as a coronavirus death if coronavirus is listed as the underlying cause of death reported on the death certificate. By definition, the underlying cause is supposed to be the cause that set off the chain of events leading to death. There is some variation in how different physicians, medical examiners, and coroners determine what will be listed as the underlying cause of death. For example, if an individual has a heart attack, is hospitalized, develops symptoms of coronavirus, and subsequently dies, the underlying cause might be listed as heart attack, or it might be listed as coronavirus. In the first scenario, this would not be counted as a coronavirus death, but in the second, it would. Many coronavirus deaths appear to be occurring among individuals with comorbidities and preexisting conditions, and it is difficult to know what will ultimately be captured as the underlying cause on the death certificate.
A related phenomenon occurs during influenza season, when we tend to see a spike in flu-related respiratory and cardiovascular disease deaths. Individuals who already had cardiovascular disease or respiratory conditions to begin with may be more susceptible to contracting and dying of influenza, while individuals who get the flu may have a higher risk of dying from cardiovascular disease. The association goes both ways and looking at flu or cardiovascular disease deaths alone may not give us the full picture.
Given the difficulties in determining who has coronavirus, a superior measure is the death rate from coronavirus, which is the number of deaths from coronavirus divided by the population. We would still have some uncertainty in the numerator due to the issues discussed above, but we would be much more confident about the denominator, which does not rely on knowing who was exposed to the virus. Since the risk of dying from coronavirus seems to differ by age, it is important to look at either age-specific measures (e.g., the death rate among adults aged 65–69) or at age-standardized measures, which account for the age distribution of the population and allow for better comparisons between, for example, countries with older populations (e.g., Italy, Japan) and countries with younger populations (e.g., the United States, New Zealand).
How will coronavirus impact life expectancy?
“It is likely that countries hard-hit by the coronavirus will see declines in life expectancy as a result of the pandemic, while other countries may not see any appreciable impacts.”It is likely that countries hard-hit by the coronavirus will see declines in life expectancy as a result of the pandemic, while other countries may not see any appreciable impacts. Reports indicate that mortality increased above its expected level in March and April in the United States.1→Emma Brown, Andrew Ba Tran, Beth Reinhard, and Monica Ulmanu, “US Deaths Soared in Early Weeks of Pandemic, Far Exceeding Number Attributed to Covid-19,” the Washington Post, April 27, 2020.
→National Center for Health Statistics, “Provisional Death Counts for Coronavirus Disease” (Covid-19). What remains to be seen is what mortality will look like during the remaining months of 2020. We could continue to see elevated mortality, but we could also see the opposite, reflecting so-called tempo or displacement effects. It is possible that some people who got coronavirus may have been quite sick to begin with and perhaps would have died later in 2020 (e.g., in September), but died earlier because they were infected with coronavirus in April. This could result in higher levels of mortality during the pandemic and slightly lower levels of mortality once it winds down.
Two questions we might ask are, if we do see a decline in life expectancy, how large will it be, and how long will it last?
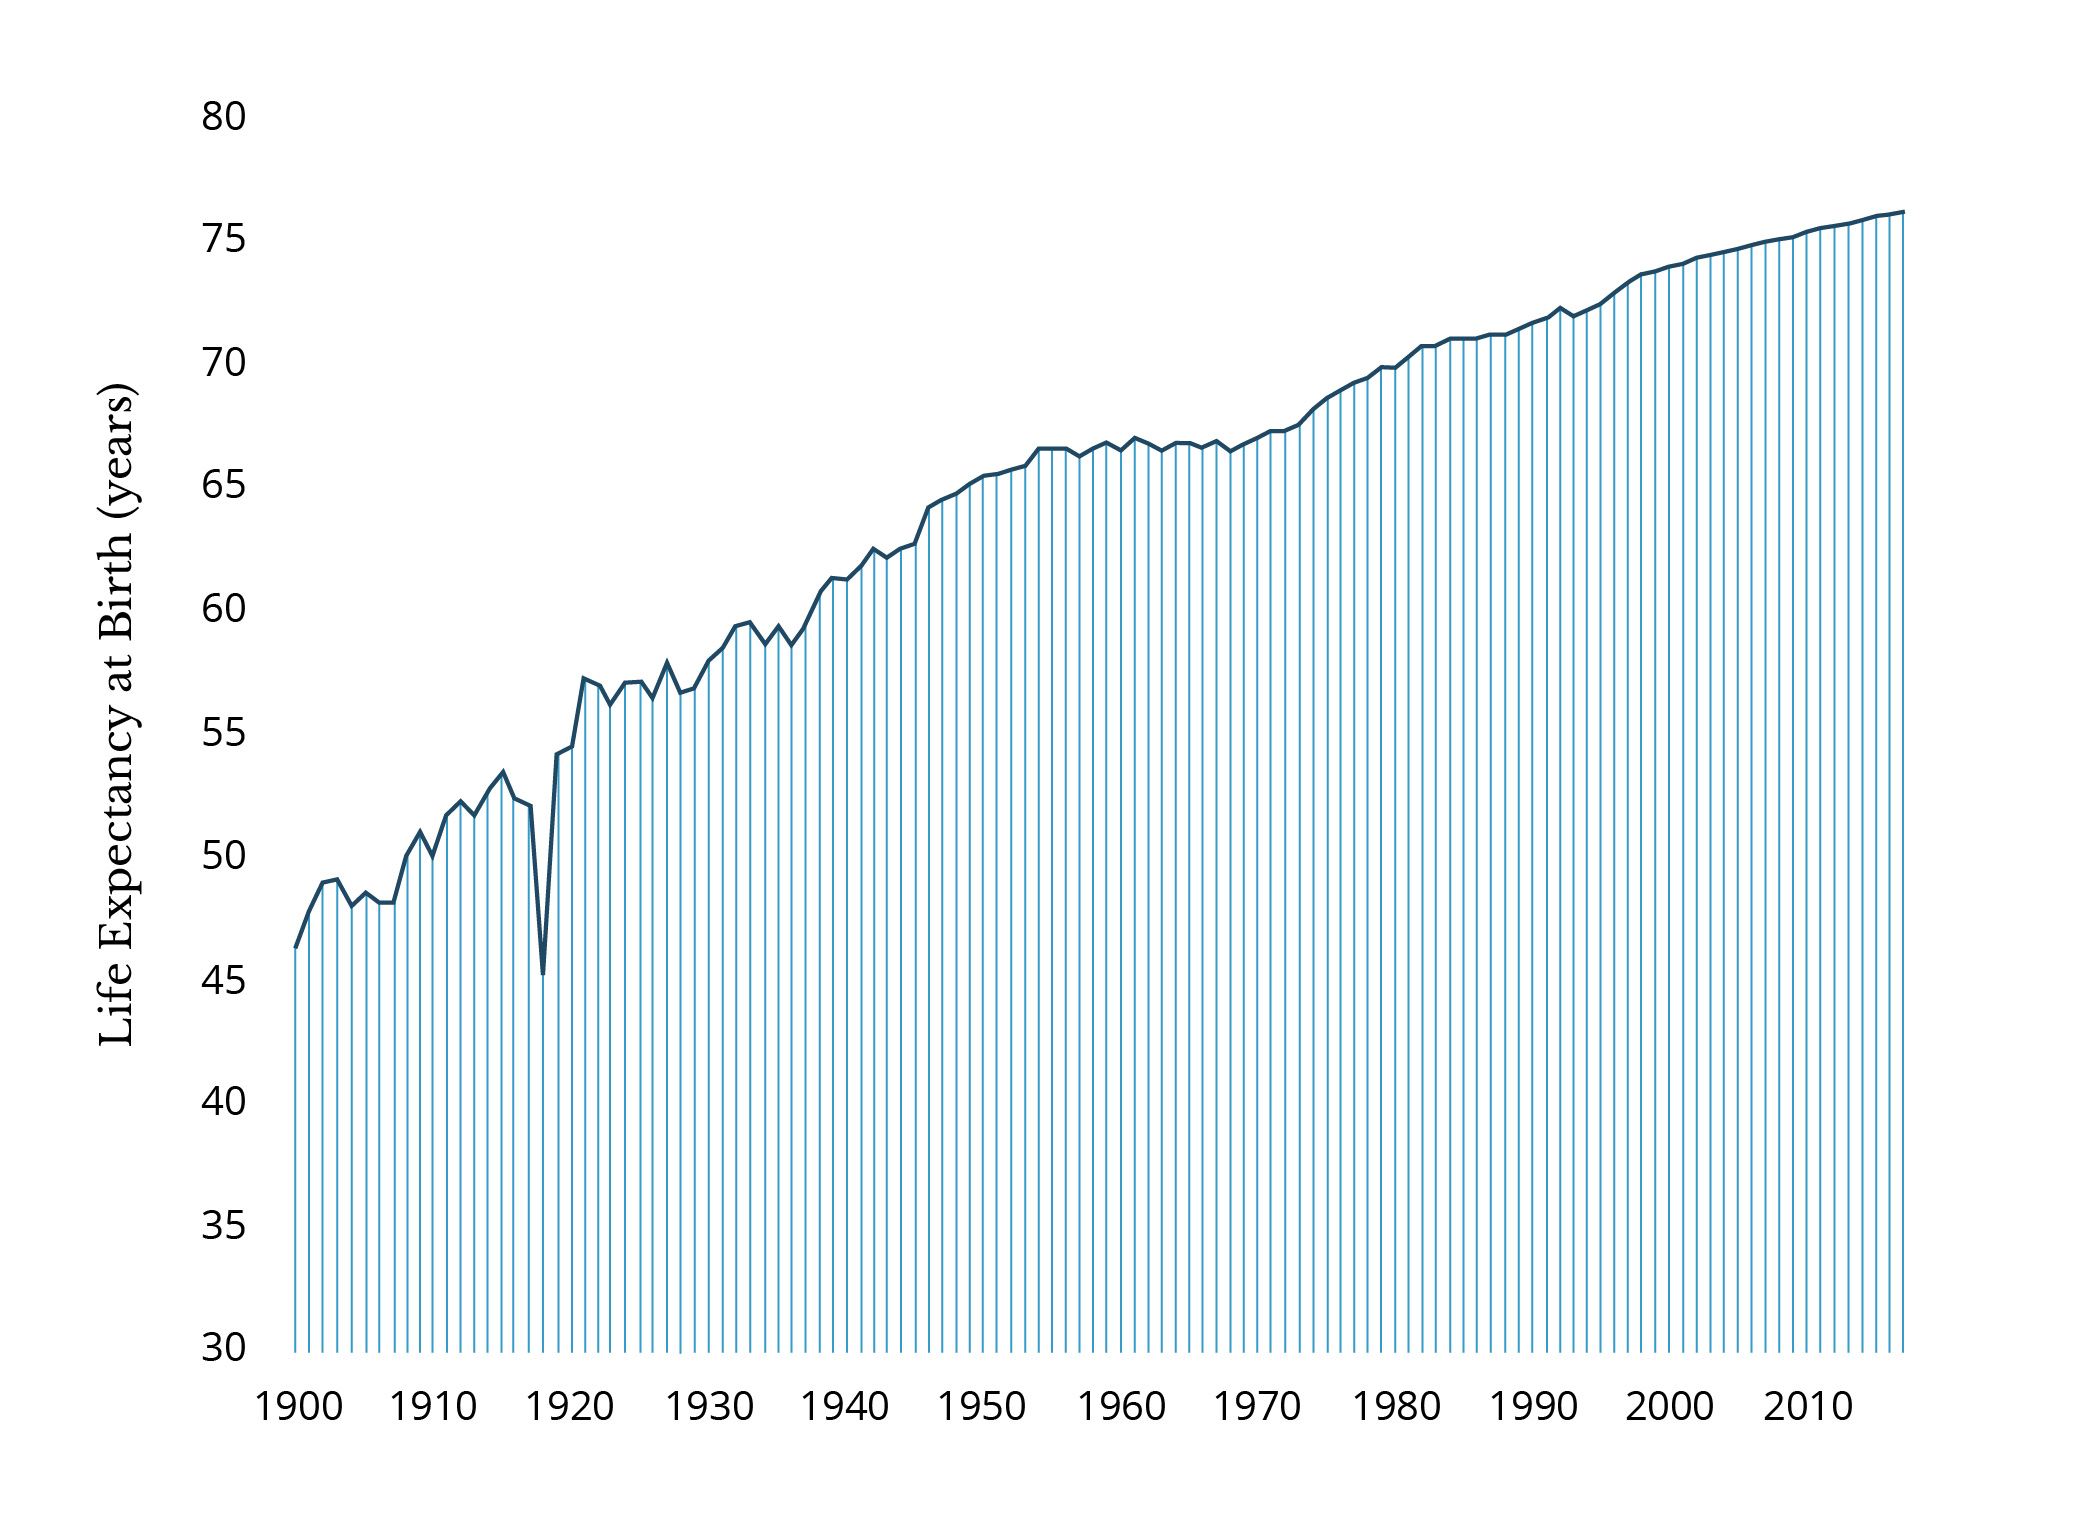
For the first question, I refer to two examples: The 1918 influenza pandemic and the 2014 declines in life expectancy that were observed in the majority of a set of high-income countries.2Jessica Y. Ho and Arun S. Hendi, “Recent Trends in Life Expectancy across High Income Countries,” BMJ 362, no. k2562 (2018). During the 1918 influenza pandemic, life expectancy in the United States dropped by about 6.8 years, but between 1918 and 1919, it increased by 8.8 years—higher than its 1917 level, putting life expectancy back on trend.
More recently, a number of high-income countries, including the United States, Italy, Germany, and the United Kingdom, simultaneously experienced life expectancy declines in 2015. This was likely related to a particularly bad flu year, and most of the countries that experienced declines saw increases in 2016 and were back on track the following year.
The United States was one exception—life expectancy continued to decline in 2016 and 2017, with only a small uptick in 2018 (the figures for 2019 have not yet been released).3Jiaquan Xu et al., “Mortality in the United States, 2018,” NCHS Data Brief, no 355 (January 2020). The coronavirus pandemic is occurring at a particularly challenging time for US mortality, coming hard on the heels of a consecutive three-year decline in life expectancy and the peak of the drug overdose epidemic. The United States already has the lowest life expectancy among our high-income peer countries, and how the country addresses the pandemic and longstanding factors influencing health and mortality will determine how we rank going forward.
Connections to policy
Life expectancy can be explicitly linked to policy by translating the gains in life expectancy we would expect to see from implementing (or not implementing) a specific policy into dollar terms. This is known as the statistical value of a life. A commonly used number is $100,000—in other words, extending life by an additional year is worth $100,000, although figures range from half of that to well into the tens of millions. Of course, there are many debates surrounding what this dollar amount should be, including but not limited to disagreements over whether additional factors should be taken into account, such as states of health, remaining years of life, levels of education and other socioeconomic characteristics, labor force productivity, and orientations toward risk-taking.
Mireille Jacobson and Tom Chang have performed a value of a statistical life calculation to translate the number of deaths we might see if no actions were taken against Covid-19 in the United States into dollar terms, arriving at an estimate of $8.5 trillion, or nearly half of the US gross domestic product.4Mireille Jacobson and Tom Chang, “The Economic Rationale for Strong Action Now against Covid-19,” STAT, March 18, 2020. Many related questions can be addressed by using a similar modeling framework. For example, one could estimate how many dollars would be saved if a vaccine for coronavirus made it onto the market by 2021 versus 2022 based on the difference in the number of lives that would be saved.
As we look to the future and try to predict what it holds, one statistic we are likely to have our eyes on is life expectancy forecasts. The Lee-Carter model,5Ronald D. Lee and Lawrence R. Carter, “Modeling and Forecasting US Mortality,” Journal of the American Statistical Association 87, no. 419 (1992): 659–671. developed by Ronald Lee and Lawrence Carter, is the most widely used model for mortality forecasting. It is used by the United States Social Security Administration, the US Census Bureau, and the United Nations, among many others. Historically, trends in mortality have been surprisingly linear. Based on the trend in past life expectancy increases and regularities in age patterns of mortality, the Lee-Carter model extrapolates this trend forward to give us a best estimate of what life expectancy will look like in the future.
“Another possibility emerges if we discover that coronavirus exposure has life course impacts that are not apparent until decades later…”One possibility is that life expectancy could get back on track and increase almost linearly like it did following the 1918 influenza pandemic (as seen in Figure 1). Another possibility emerges if we discover that coronavirus exposure has life course impacts that are not apparent until decades later—for example, if young adults exposed to coronavirus today are at higher risk of developing chronic conditions in the coming decades, this may increase their mortality. It is also possible to incorporate this into the Lee-Carter model using an approach similar to the one used by Haidong Wang and Samuel Preston.6Haidong Wang and Samuel H. Preston, “Forecasting United States Mortality Using Cohort Smoking Histories,” PNAS 106, no. 2 (2009): 393–398. Cigarette smoking is a leading cause of premature morbidity and mortality, and American smokers quit smoking in record numbers over the course of the twentieth century. Wang and Preston incorporated these declines in smoking into the Lee-Carter model to demonstrate that, in fact, we should expect to see faster life expectancy improvements than if we did not take the declines in smoking into account.
Life expectancy is the most informative and accurate summary measure of the state of health for a population. In addition to longevity, however, we may also be interested in the quality of those years of life or how our health will decline as we age. Researchers have developed a number of measures that aim to capture these dimensions. For example, healthy active life expectancy (HALE) provides an estimate of how many years an individual can expect to live in good health (i.e., free of disability). The disability-adjusted life year (DALY) measures how many years are lost to premature mortality (years or life lost or YLL) and how many years are lost to disease or disability (YLD), with the remaining years of life lived providing an estimate of years a newborn can expect to live free of disease or disability.7Hmwe Hmwe Kyu et al., “Global, Regional, and National Disability-Adjusted Life-Years (DALYs) for 359 Diseases and Injuries and Healthy Life Expectancy (HALE) for 195 Countries and Territories, 1990–2017: A Systematic Analysis for the Global Burden of Disease Study 2017,” The Lancet 392, no. 10159 (2018): 1859–1922. What these measures tell us depends heavily on the assumptions made about the impacts of particular levels of disability or chronic conditions (for example, how disabling cardiovascular disease is compared to arthritis, and how much each of these conditions increases the risk of dying prematurely).
In summary, demographers, epidemiologists, and other social scientists have invented a number of tools and models that can be used to evaluate the health of a population. Each of these measures has its own strengths and limitations. As we enter an increasingly uncertain world experiencing a global pandemic, it is important that we recognize that these measures are often sensitive to short-term fluctuations, because they summarize the health and mortality conditions prevailing at a point in time. There is far less certainty about what will happen in the future, but the demographic and epidemiologic models developed over the past several decades will be central to our understanding of the evolution of the health of populations.
References:
→National Center for Health Statistics, “Provisional Death Counts for Coronavirus Disease” (Covid-19).
