“A key characteristic of a democracy,” according to Robert Dahl, is “the continuing responsiveness of the government to the preferences of its citizens, considered as political equals.”1 New Haven, CT: Yale University Press, 1972More Info → Much empirical research over the past half century, most of it focusing on the United States, has examined the relationship between citizens’ policy preferences and the policy choices of elected officials. According to Robert Shapiro, this research has generated “evidence for strong effects of public opinion on government policies,” providing “a sanguine picture of democracy at work.”2Robert Y. Shapiro, “Public Opinion and American Democracy,” Public Opinion Quarterly 75 (2011): 982–1017.
In recent years, however, scholars of American politics have produced striking evidence that the apparent “strong effects” of aggregate public opinion in these studies mask severe inequalities in responsiveness.3For example, see
→Martin Gilens, Affluence and Influence: Economic Inequality and Political Power in America (New York and Princeton, NJ: Russell Sage Foundation and Princeton University Press, 2012).
→Larry M. Bartels, Unequal Democracy: The Political Economy of the New Gilded Age, 2nd ed. (New York and Princeton, NJ: Russell Sage Foundation and Princeton University Press, 2016).
→Martin Gilens and Benjamin I. Page, “Testing Theories of American Politics: Elites, Interest Groups, and Average Citizens,” Perspectives on Politics 12 (2014): 564–581. As Martin Gilens put it, “The American government does respond to the public’s preferences, but that responsiveness is strongly tilted toward the most affluent citizens. Indeed, under most circumstances, the preferences of the vast majority of Americans appear to have essentially no impact on which policies the government does or doesn’t adopt.”4Gilens, Affluence and Influence, 1.
One possible interpretation of these findings is that the American political system is anomalous in its apparent disregard for the preferences of middle-class and poor people. In that case, the severe political inequality documented there would presumably be accounted for by distinctive features of the United States, such as its system of private campaign finance, its weak labor unions, or its individualistic political culture. But, what if severe political inequality is endemic in affluent democracies? That would suggest that fiddling with the political institutions of the United States to make them more like Denmark’s (or vice versa) would be unlikely to bring us significantly closer to satisfying Dahl’s standard of democratic equality. We would be forced to conclude either that Dahl’s standard is fundamentally misguided or that none of the political systems commonly identified as democratic comes anywhere close to meriting that designation.
Analyzing policy responsiveness
“I have attempted to test the extent to which policymakers in a variety of affluent democracies respond to the preferences of their citizens considered as political equals.”To address this question, I have attempted to test the extent to which policymakers in a variety of affluent democracies respond to the preferences of their citizens considered as political equals. My analyses focus on the relationship between public opinion and government spending on social welfare programs, including pensions, health, education, and unemployment benefits. These programs represent a major share of government spending in every affluent democracy and, arguably, an important source of public well-being.5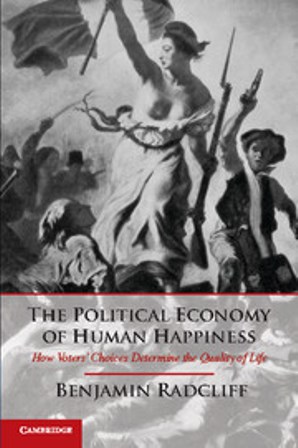 New York: Cambridge University Press, 2013More Info → Moreover, social spending figures prominently in the comparative literature on the political impact of public opinion in affluent democracies, with major scholarly works suggesting that it is significantly influenced by citizens’ preferences.6See
→Clem Brooks and Jeff Manza, Why Welfare States Persist: The Importance of Public Opinion in Democracies (Chicago: University of Chicago Press, 2007).
→Stuart N. Soroka and Christopher Wlezien, Degrees of Democracy: Politics, Public Opinion, and Policy (New York: Cambridge University Press, 2010).
My analyses employ data on citizens’ views about social spending and the welfare state from three major cross-national survey projects—the International Social Survey Programme (ISSP), the World Values Survey (WVS), and the European Values Survey (EVS). In combination, these three sources provide relevant opinion data from 160 surveys conducted between 1985 and 2012 in 30 countries, including most of the established democracies of Western Europe and the English-speaking world and some newer democracies in Eastern Europe, Latin America, and Asia. I examine shifts in (real per capita) social spending in the two years following each survey. Does greater public enthusiasm for the welfare state lead to increases in social spending, other things being equal? And, more importantly here, do the views of low-income people have the same apparent influence on policy as the views of affluent people?
I allow for a variety of other potential influences on social policy, including national wealth (GDP per capita), demographic pressures (the ratio of retirement-age to working-age people), and durable differences in national political cultures and state capacity. These factors, along with public opinion, produce an “effective demand” for social spending in any given country-year. Observed changes in spending then reflect a process of dynamic equilibration in which policymakers adjust policy in response to effective demand.7I also allow for short-term changes in GDP and unemployment to affect spending through the operation of “automatic stabilizers” adjusting welfare benefits to shifts in economic conditions.
The key parameter capturing disparities in responsiveness is the low-income responsiveness ratio, which measures the relative impact of support for social spending at the bottom of the income distribution in each country-year. If this ratio is 1.0, the views of affluent and poor people are equally influential in accounting for shifts in social spending; in contrast, a low-income responsiveness ratio of zero implies that the views of poor people have no impact on policy.8I summarize the preferences of affluent and poor people in each country-year using the endpoints of a linear regression of individual survey respondents’ opinions on their (percentile) positions in the income distribution for that country-year. Then I regress observed changes in social spending across country-years on the preferences of affluent and poor people, among other factors. Given the assumption of a linear relationship between preferences and income (which fits the data for most country-years rather well), the relative political influence of a person at any point in the income distribution can be represented as a weighted average of the estimated effects of high-income opinion and low-income opinion. For example, the estimated low-income responsiveness ratio of −.86 in my baseline specification implies that middle-income people have about (.5×1.0 + .5×(−.86)=) 7 percent as much influence on social spending policy as people at the top of the income distribution.
The first four rows of the accompanying table present key results from four versions of my empirical analysis—(1) using the WVS and EVS data only; (2) including also the data from ISSP (with due allowance for differences in instrumentation between these sources); (3) excluding two outliers (in which very large increases in social spending were associated with changes in the political systems of Poland and South Korea in the 1990s); and (4) weighting the data from each country-year by population (to ensure that the results hold among large as well as small countries).
“In every instance the results suggest that the views of poor people have no impact on social spending.”Remarkably, in every instance the results suggest that the views of poor people have no impact on social spending. Indeed, the estimates of low-income responsiveness are negative in every case, and sufficiently precise to confidently reject the hypothesis that poor people have even half as much political influence as affluent people.9For the hypothesis that the poorest citizens in each country-year had half as much political influence as the most affluent citizens, the relevant t-statistics range from 3.7 to 5.9. The t-statistics for the null hypothesis of equal influence range from 5.6 to 8.1. If these results are not wildly misleading, they dramatically corroborate the pessimistic findings regarding disparities in responsiveness in the United States.
Disparities in responsiveness are ubiquitous in affluent democracies
The apparent impact of public opinion on social spending reflects a highly unequal distribution of political influence, with policymakers responding significantly to the preferences of affluent citizens but not at all (or even negatively) to the preferences of poor citizens. In a domain where affluent and poor citizens often express very different views, this disparity in apparent influence has substantial implications for welfare state policies as well as for our broader understanding of democratic politics. Specifically, my projections suggest that biased responsiveness to public preferences depresses the effective demand for social spending by 10–15 percent in most country-years.10My estimates of the impact of biased responsiveness on the effective demand for social spending are computed by substituting equal responsiveness to low- and high-income preferences for the biased responsiveness reflected in the parameter estimates in my baseline specification: the relative weights of 1.00 for high-income preferences and −.86 for low-income preferences are replaced by equal weights of .07 for both high- and low-income preferences, preserving the total estimated impact of preferences on spending but equalizing the implied influence of citizens across the income spectrum. Cross-national variation in the impact of biased responsiveness reflects differences in the extent of class conflict in support for the welfare state. (If the opinions of affluent and poor people were identical, responding less to the former and more to the latter would have no impact on effective demand for social spending.)
The remaining rows of the table report the corresponding estimates of low-income responsiveness from a variety of additional analyses focusing on varying subsets of country-years differentiated on the basis of geography, political culture, political institutions, or economic circumstances: (5) established democracies (excluding ten country-years in which democratic systems were less than a decade old); (6) “social democracies” of continental Europe and Scandinavia versus (7) “liberal democracies” of the English-speaking world and Asia; (8) all European democracies, including the formerly communist countries of Eastern Europe and a few liberal democracies (Great Britain, Ireland, and Switzerland) along with the social democracies of continental Europe; (9) federal systems versus (10) those with centralized national policy-making systems; (11) countries with proportional representation versus (12) those with majoritarian electoral systems; (13) the wealthiest country-years (with GDP per capita in excess of $30,000) versus (14) less wealthy country years; and (15) the most economically unequal country-years (with post-transfer Gini indices in excess of 30) versus (16) less economically unequal country-years.
“The striking pattern of biased responsiveness seems to hold with remarkable consistency across affluent democracies.”These differentiated analyses of policy responsiveness capture just a few of the many dimensions of political, cultural, institutional, and economic variation that might plausibly affect the relationship between citizens and their governments with respect to social spending. Moreover, the statistical imprecision of many of the results summarized in the table underlines the limitations of the data employed here for analyzing patterns of responsiveness in distinct subsets of my sample of affluent democracies. Nonetheless, the striking pattern of biased responsiveness seems to hold with remarkable consistency across affluent democracies. It is clearly not attributable to any single country or cluster of countries, or to (at least) the specific institutional arrangements that have figured most prominently in the scholarly literature on comparative representation. Indeed, none of the subsets of country-years considered here provides any evidence of positive responsiveness of governments to the preferences of low-income citizens. Every single estimate of the “low-income responsiveness ratio” is negative, and sufficiently precise to confidently reject the hypothesis that governments are even half as responsiveness to the preferences of poor people as they are to the preferences of affluent people.11The hypothesis that poor people’s preferences are half as influential as those of affluent people can be rejected in every instance, with t-statistics ranging from 2.0 to 6.3. Thus, while much more careful comparisons remain to be done, it seems hard to avoid the provisional conclusion that, in this policy domain, affluent democracies are more similar than different in their disparate responsiveness to the preferences of their citizens.
Political inequality and democratic politics
Obviously, my analysis has greatly simplified the complexity of social welfare policymaking in thirty different countries over a period of three decades. Statistical analyses based on such a small and heterogeneous sample of policymaking experience must be suggestive rather than definitive. The apparent evidence of hyper-inequality presented here may turn out to be an artifact of peculiar patterns of measurement error12See
→Christopher Achen, “Proxy Variables and Incorrect Signs on Regression Coefficients,” Political Methodology 11 (1985): 299–316.
→Gilens, Affluence and Influence, 253–258. or other problems of data or model specification. In the meantime, however, my findings suggest that severe disparities in responsiveness are rampant in contemporary affluent democracies, regardless of the significant differences in their political cultures, institutions, and economies.
These findings seem to me to underscore a variety of important questions facing contemporary scholars of democratic politics. Why does policy responsiveness to citizens’ social welfare preferences seem to be so limited, despite the strong presumption in the scholarly literature that electoral competition will ensure popular control of salient public policies?13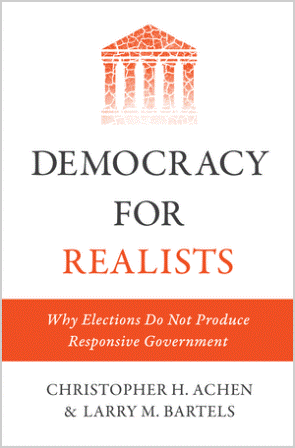 Princeton, NJ: Princeton University Press, 2016More Info → How do affluent citizens manage to exert (if indeed they do manage to exert) much more effective influence in the policymaking process, achieving substantial reductions in social spending relative to the levels apparently preferred by the public as a whole?14
 New York: Simon and Schuster, 2010More Info → What changes, if any, in democratic processes or political institutions would produce greater correspondence between citizens’ preferences and social welfare policies?15
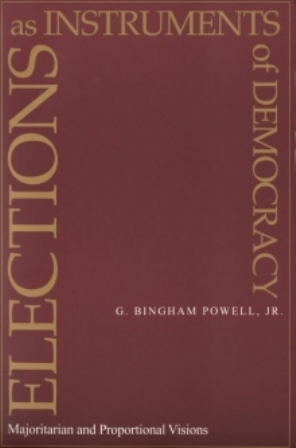 New Haven, CT: Yale University Press, 2010More Info → And would ordinary citizens actually be better off if they got their way?16Radcliff, The Political Economy of Human Happiness.
Table 1. The ubiquity of extreme political inequality
Estimates of the relative impact of low-income preferences on changes in social spending in 30 OECD democracies, 1985–2014. Non-linear regression parameter estimates with standard errors (clustered by country) in parentheses.
| Sample | N (countries) | Low-income responsiveness ratio |
|---|---|---|
| (1) WVS/EVS only | 106 (30) | −.54 (.24) |
| (2) ISSP and WVS/EVS (baseline specification) | 141 (30) | −.86 (.23) |
| Spending change < 25% | 139 (30) | −1.09 (.31) |
| (4) Population-weighted | 141 (30) | −.50 (.27) |
| (5) Established democracies | 131 (29) | −1.81 (.97) |
| (6) Social democracies | 61 (13) | −1.33 (.60) |
| (7) Liberal democracies | 55 (10) | −.61 (.32) |
| (8) European democracies | 98 (21) | −1.32 (.58) |
| (9) Federal systems | 64 (13) | −.19 (.34) |
| (10) Centralized systems | 77 (18) | −.83 (.21) |
| (11) Proportional systems | 86 (20) | −1.57 (.92) |
| (12) Plurality systems | 55 (11) | −.46 (.31) |
| (13) Wealthiest (GDP/capita > $30,000) | 79 (21) | −.62 (.34) |
| (14) Less wealthy (GDP/capita < $30,000) | 62 (21) | −.85 (.40) |
| (15) Most unequal (post-transfer Gini > 30) | 70 (17) | −.77 (.23) |
| (16) Less unequal (post-transfer Gini < 30) | 71 (20) | −1.10 (.71) |
This piece summarizes research reported in my working paper on “Political Inequality in Affluent Democracies: The Social Welfare Deficit” (Center for the Study of Democratic Institutions #5-2017: http://www.vanderbilt.edu/csdi/research/papers.php), presented at the Workshop on Political Inequality and Democratic Innovations (Democratic Participation—A Broken Promise?), Villa Vigoni, March 14–17, 2017.
References:
→Martin Gilens, Affluence and Influence: Economic Inequality and Political Power in America (New York and Princeton, NJ: Russell Sage Foundation and Princeton University Press, 2012).
→Larry M. Bartels, Unequal Democracy: The Political Economy of the New Gilded Age, 2nd ed. (New York and Princeton, NJ: Russell Sage Foundation and Princeton University Press, 2016).
→Martin Gilens and Benjamin I. Page, “Testing Theories of American Politics: Elites, Interest Groups, and Average Citizens,” Perspectives on Politics 12 (2014): 564–581.
→Clem Brooks and Jeff Manza, Why Welfare States Persist: The Importance of Public Opinion in Democracies (Chicago: University of Chicago Press, 2007).
→Stuart N. Soroka and Christopher Wlezien, Degrees of Democracy: Politics, Public Opinion, and Policy (New York: Cambridge University Press, 2010).
→Christopher Achen, “Proxy Variables and Incorrect Signs on Regression Coefficients,” Political Methodology 11 (1985): 299–316.
→Gilens, Affluence and Influence, 253–258.


