Over the last 30 years, as party polarization has increased, bipartisan compromise to pass legislation has become normatively more appealing and apparently less attainable, both in Congress and many state legislatures. While extensive literature exists on party polarization and gridlock, very few studies have sought to understand the individual legislator foundations of these phenomena. The individual actions legislators take in authoring legislation, building coalitions to pass legislation, and voting on legislation collectively determine which legislation passes or fails and whether it has bipartisan support. This essay outlines my research so far to identify the electoral and institutional factors that determine the extent to which individual legislators spend time forming cross-party rather than within-party coalitions to pass legislation.
This analysis introduces a new measure of legislative activity—what I call coalition building bipartisanship—defined as the difference in time legislators devote to cross-party versus within-party coalition building to pass legislation. Existing studies of legislative behavior focus primarily on floor votes. Yet, member priorities are better reflected by the time and effort they spend pursuing their own legislative agendas. While some legislation, such as technical fixes to language or procedure, are uncontroversial and easily pass, much legislation passes only after a lengthy process of negotiation and compromise. If a bill sponsor is serious about passing legislation, they need to devote time and effort to negotiate and build a coalition. These coalitions can be partisan, consisting only of majority party members, or bipartisan, with members from both parties.
Building coalitions across and within parties
The measure of coalition building bipartisanship is constructed from five-point survey items that asked legislators “how much time do you actually spend” on eight legislative activities, including “building coalitions across parties to pass legislation,” and “building coalitions within own party to pass legislation.” The dependent variable in this analysis is cross-party time minus within-party time, with positive values indicating more time spent building cross-party coalitions and negative values indicating more time spent building within-party coalitions. These items were in three national surveys of state legislators conducted in 1995, 2002, and 2014; the third survey also included members of Congress and their senior staff.1The 2014 survey was funded by the Edmond J. Safra Center for Ethics at Harvard, the National Conference for State Legislatures, and, the Congressional portion, by the Dirksen Congressional Center. I received funding from Safra and Dirksen, and NCSL provided the remaining funding needed in a cooperative arrangement. The 2002 survey was part of the Joint Project on Term Limits, a cooperative effort between state legislative scholars, including myself, NCSL, the Council of State Governments, and the State Legislative Leaders Foundation. Support for the survey was provided in part from NSF Grant #SES-02131. The 1995 survey was conducted by John Carey, Richard Niemi, and Lynda Powell. It was supported by NSF Grant SBR-9422375. For details on the 1995 survey, see Carey, Niemi and Powell (2000). The anonymized surveys for 1995 and 20002 are available from the Inter-university Consortium for Political and Social Science Research: 1995 State Legislator Survey and Contextual Data, ICPSR 3021, John Carey, Richard Niemi and Lynda Powell; 2002 State Legislative Survey, ICPSR 20960, John Carey, Richard Niemi, Lynda Powell and Gary Moncrief.
As shown in Figure 1, in 1995 and 2002, just over half the legislators spent an equal amount of time on each type of coalition building. By 2014, the percent of legislators spending an equal amount of time on each decreased sharply, while the fraction spending more time on within-party coalition building increased.
Figure 1. Time spent building cross-party coalitions

Chambers differ greatly in bipartisan coalition building time
These aggregate findings, however, conceal the considerable variability in the time spent on coalition building in the 101 chambers in these time periods. Figure 2 shows the averages of the mean differences in time spent by chamber on building cross-party coalitions minus within-party coalitions, that is, coalition building bipartisanship by year, and shows its over time decrease. In each year, five or six chambers have a mean of 0; this indicates that, on average, members spend the same amount of time on each type of coalition building. But as time passes, fewer chambers exceed this value. In 1995, members in 33 percent of chambers spent more time building cross-party coalitions than building within-party coalition. In each subsequent survey the fraction was lower—22 percent in 2002 and 14 percent in 2014.2The dependable variable is averaged for each of the 101 chambers for each year. However, the US Congress, with its two chambers, is missing in the 1995 and 2002 surveys, meaning those two years account for 99 chambers.
Figure 2. Average time spent on coalition building across state legislative chambers, by year3Each dot represents a state’s legislative chamber. There are 99 chambers in 1995 and 2002 (Nebraska has a unicameral legislature and Congress is omitted), respectively. There are 101 for 2014 (this includes the US House and Senate).
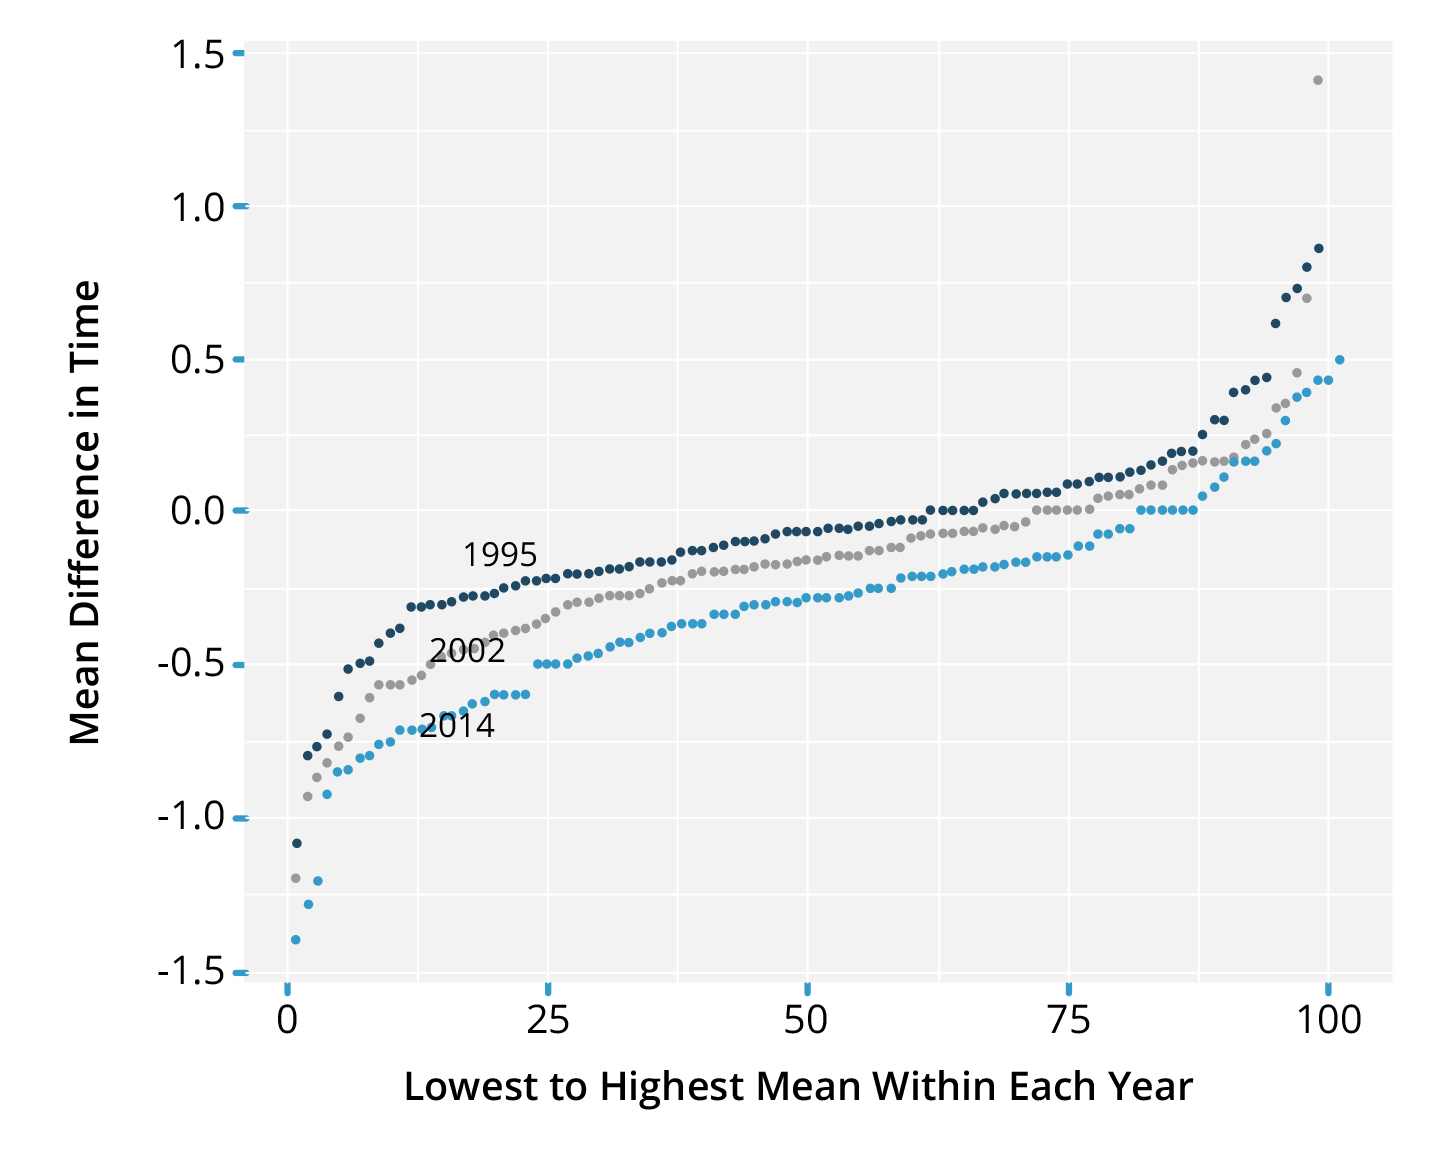
What is most interesting in Figure 2, however, is the substantial variation in the chamber means of coalition building bipartisanship.
Explaining the variation in bipartisan coalition building
Can we explain the differences in individual legislator coalition building bipartisanship that cumulate to such substantial chamber differences? I use a Bayesian hierarchical model to simultaneously test eleven hypotheses, which are grouped in the following three groups. The model explains 88 percent of the variation in the 299-chamber means shown in Figure 2, and all but one of the hypothesized relationships are found to be in the direction specified and statistically significant.
Margin of control
A member of the majority in a chamber could reasonably have some uncertainty about whether enough members of her own party will vote for her legislation to win a floor vote without some minority party support. Although the majority party in a chamber has the votes to win a floor vote if all members vote together, policy dissension within its ranks provides an opportunity for members of the minority to defeat the majority’s bill or to build bipartisan support to pass their legislation instead. All else equal, the smaller the margin of majority control, the greater the risk of defeat for a majority member’s legislation and hence the advantage of securing some support from the other party. However, for minority members, the greater the margin of the majority party’s control, the harder a minority member must work to secure a minimal winning coalition to win a floor vote. Therefore, the relationship between the majority party’s margin of control and the time a member devotes to building a cross-party coalition of support for her legislation will be negative for a majority member and positive for a minority member.
Applying the same logic used to derive the previous hypotheses, the greater a legislator’s partisan disadvantage in passing legislation, the more time the member will devote to building bipartisan rather than partisan coalitions to pass legislation. Divided government, when one party controls one branch while the opposition the other, disadvantages majority members in a chamber, while it advantages minority members. Thus, majority members in a chamber spend relatively more time on coalition building bipartisanship under divided government than under unified government. Minority party members, meanwhile, spend relatively more time on coalition building bipartisanship under unified government than under divided government.
Another disadvantage related to margins of control in legislatures concerns the state legislatures that require more than a simple majority to pass legislation. Members in these chambers need to build supermajorities, making more likely the need for bipartisan support through coalition building bipartisanship.
Party leadership
Majority party leadership is hypothesized to use its influence to keep the majority caucus unified on policy, discouraging bipartisanship. And, based on other survey items in the 2014 survey, members overwhelming agree leaders should, in fact, do so. In addition, strong party leadership should have a spillover effect on minority party members as well by offering fewer partners for them to work with on legislation. The more powerful the majority party leadership, the less majority party members engage in coalition building bipartisanship. Likewise, minority party members find fewer partners among the majority willing to work with them.
Leadership roles and length of tenure may affect members’ coalition building activities. In the 2014 survey, legislators were asked how much time their leaders should spend on a list of activities. Building legislative coalitions across parties ranked lower in terms of desired leader time, than keeping the caucus united on floor votes. Other work found a strong correlation between member expectations of leaders and leaders’ priorities.4 Ann Arbor, MI: University of Michigan Press, 2012More Info → Thus, leaders should prioritize working with their own members over bridging differences with the other party. Hence, party leaders will devote less time to coalition building bipartisanship than ordinary members.
Ideology and partisanship
By modeling the behavior of individuals, I examine which legislators spend time building cross-party coalitions. Within a legislature, we would expect less extreme—i.e., more moderate—legislators to spend more time building cross-party coalitions.5Member moderation is based a 7-point liberalism-conservatism scale asked on the legislator surveys. The ideological distance they need to bridge to the other party will be less than it is for the more extreme members of their caucus. Further, by balancing off the more extreme members of their own party with members of the opposing party they may even be more likely to construct legislation closer to their own ideal point. Meaning, the more ideologically moderate the legislator, the more time he will devote to coalition building bipartisanship.
Similarly, general election competitiveness at the district level has been argued to promote bipartisanship in bill cosponsorship by pressuring “members from more competitive districts to show they are moderate and willing to work across the aisle.”6Laurel Harbridge, “Congressional Agenda Control and the Decline of Bipartisan Cooperation” (unpublished manuscript, 2010), 2. This argument is also consistent with many, although not all, of the findings in the extensive literatures relating constituency competitiveness to voting party loyalty and to member ideology. Constituency competitiveness is measured as the partisan favorability toward the legislator—in other words, a legislator’s perception of the fraction of the constituency identifying with her party rather than with the other major party.
If constituency competitiveness influences bipartisan behavior simply through the intervening variable of moderation, competitiveness will be insignificant in the estimated model that includes member moderation. Alternatively, constituency competitiveness may have a true direct effect; one that does not work thorough a member’s one-dimensional ideology. For example, a member may work to implement bipartisan legislation on issues that are less partisan—such as “pork,” by securing aid for an important new bridge—rather than divisive “social issues,” such as abortion. If constituency competitiveness has such an effect, the more competitive the constituency, the more time a member will devote to coalition building bipartisanship.
As the gridlock literature argues, the more polarized the parties, the greater the policy difference that must be bridged between the parties and the less likely bipartisan agreements will be reached. Similarly, the larger the ideological difference between the parties that must be bridged to reach a compromise, the less time will be devoted to bipartisan coalition building.
Member ideological moderation and constituency competitiveness result in greater bipartisan coalition building as hypothesized. Ideological difference between the parties does not, which is not substantively or statistically significant. This suggests, at least, more exploration of the argument that ideological polarization between the parties itself has a direct effect on coalition bipartisanship.
The longer a member’s length of tenure, the more time he will devote to coalition building bipartisanship. Members with more tenure may, over time, have formed more relationships with members of the other party than more recently elected members, and these relationships may foster greater legislative bipartisanship.
This preliminary work is a first step in understanding bipartisanship in the individual actions legislators take in authoring legislation, building coalitions to pass legislation and voting on legislation.