Through their exercise of political voice, Americans inform public officials of their preferences and needs, but not all people speak as loudly as others. The resulting inequality of political voice violates the democratic ideal of equal consideration of citizens’ concerns. Political voice is extremely unequal in America today. When we discussed such inequalities at a research seminar some years ago, a friend asked, “Are you describing a new and disturbing trend or an old and disturbing process?” In this piece, we explore trends in inequality of political voice in the United States during a period of increasing economic inequality—what is often referred to as the New Gilded Age.1This piece is drawn from our recently published book, Unequal and Unrepresented: Political Inequality and the People’s Voice in the New Gilded Age (Princeton: Princeton University Press, 2018), chap. 11.
Political voice can be understood as any activity undertaken by a citizen or organization with “the intent or effect of influencing government action—either directly by affecting the making or implementation of public policy or indirectly by influencing the selection of people who make those policies.”2Sidney Verba, Kay Lehman Schlozman, and Henry E. Brady, Voice and Equality: Civic Voluntarism in American Politics (Cambridge, MA: Harvard University Press, 1995), 38. Whether expressed in individual activity or through organizations, inequalities of political voice on the basis of socioeconomic status (SES) have been a feature of American politics at least since we have had the tools to measure them systematically. Moreover, such inequalities have become, in complicated ways, more pronounced in recent years.
The political voice of individuals
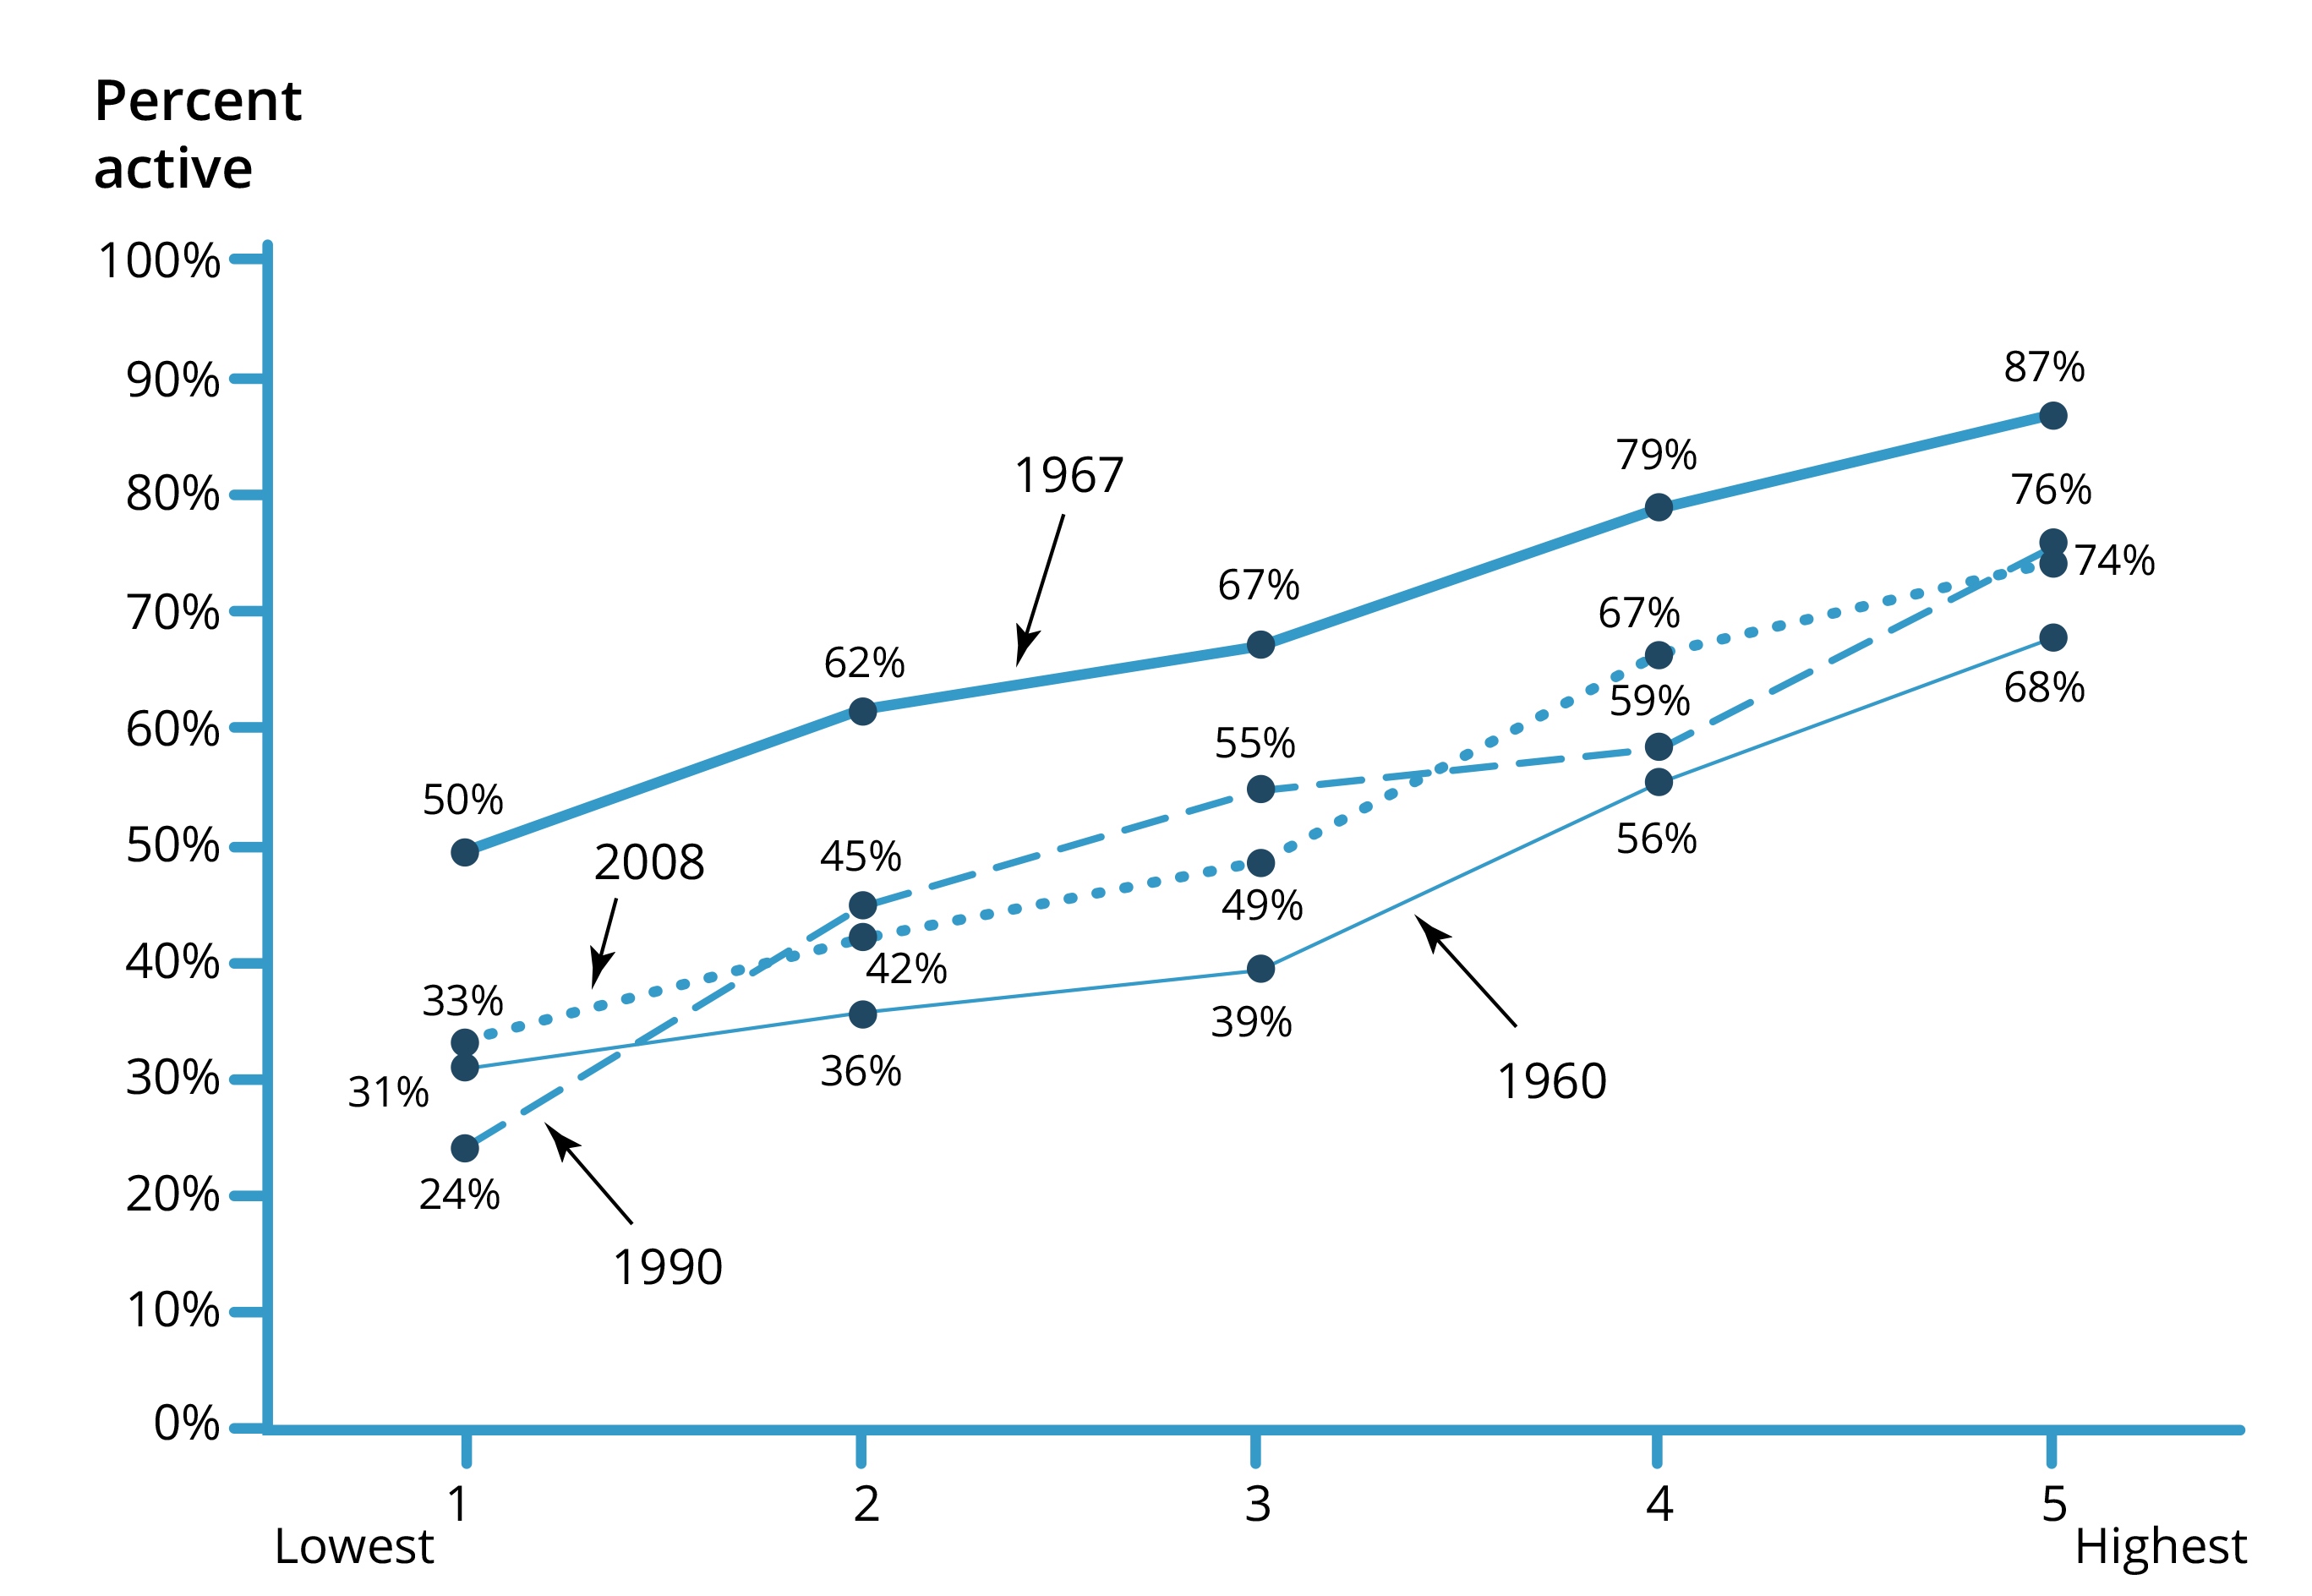
It is easy to show that unequal political voice is a persistent feature of American politics. Across several decades, the same kinds of individuals and organized interests have been disproportionately represented in politics. Although particular public issues and citizen concerns may be transitory, the affluent and well educated are consistently overrepresented. Figure 1, which presents data across half a century from surveys with similar questions about a variety of modes of participation beyond voting, shows that inequalities of political voice have been present in American politics for a long time.3The data are drawn from the following studies: 1959—Gabriel Almond and Sidney Verba, The Civic Culture (Princeton, NJ: Princeton University Press, 1963; Princeton Legacy Library, 2015); 1967—Sidney Verba and Norman H. Nie, Participation in America (New York: Harper and Row, 1972; The University of Chicago Press, 1987); 1990—Sidney Verba, Kay Lehman Schlozman, and Henry E. Brady, Voice and Equality: Civic Voluntarism in American Politics (Cambridge, MA: Harvard University Press, 1995); 2008—August Tracking 2008 Survey of the Pew Internet and American Life Project. For full documentation and technical notes, see Schlozman, Brady, and Verba, Unequal and Unrepresented. In each of the surveys, dating back to 1960, the average amount of political activity rises steeply across five quintiles of socioeconomic status. Presumably, the association between socioeconomic status and political voice dates back much further than the half century for which we have data.
Figure 1. Continuing stratification of political participation: Political activity by socioeconomic status (SES) quintile, 1960, 1967, 1990, 20084Data source: 1960—Civic Culture Study; 1967—Political Participation in America; 1990—Citizen Participation Study; 2008—Pew Internet and American Life Survey.
Note: The figure shows by SES quintiles the percentage engaging in at least one political act other voting. The data for 1967, 1969, 1990, and 2008 are based on the same five measures of activity: working in a political campaign, contacting a government official, belonging to a political organization, and working with others on a community issue. The data for 1960 are based on a somewhat different set of activities, although ones that closely parallel those used in the other studies.
By separating the various modes of expressing political voice, beginning with voting, we can see this pattern of inequality in more detail. Figure 2 uses data from the American National Election Studies (ANES) for the sixteen presidential elections between 1952 and 2012 to show the SES stratification in voting turnout.5Because voting turnout in nonpresidential years is inevitably lower than in presidential elections, we restrict our analysis to the sixteen presidential elections between 1952 and 2012. Because voting turnout is high in comparison to engagement in other participatory acts, voting is—although structured by education and income—relatively more egalitarian than other kinds of participation except for protesting. Still, Figure 2 indicates a striking level of inequality. Notably, the lines tracing voting turnout over time for the five SES quintiles array themselves in order from top to bottom and never cross. Turnout in the highest-SES quintile has been rather consistent over the years, hovering around 90 percent. In the middle and the two lower quintiles, there has been considerably more fluctuation; voting in the lowest quintile has varied between 40 percent and just over 60 percent. Scholarly consensus about persistent socioeconomic bias in voter turnout is not matched by agreement as to whether increasing economic inequality has affected inequality in voting. In their analysis of turnout between 1972 and 2008, a period that predates most of the recent voter ID laws, Jan Leighley and Jonathan Nagler say that what they “do not see is an increase in income bias in turnout that is anything like the increase in income inequality over this period.”6Jan E. Leighley and Jonathan Nagler, Who Votes Now?: Demographics, Issues, Inequality, and Turnout in the United States (Princeton: Princeton University Press, 2014), 28. Emphasis in the original.
Figure 2. Voting percentages over time by SES quintile, 1952–20127Data source: American National Election Studies (ANES) (1952–2012).

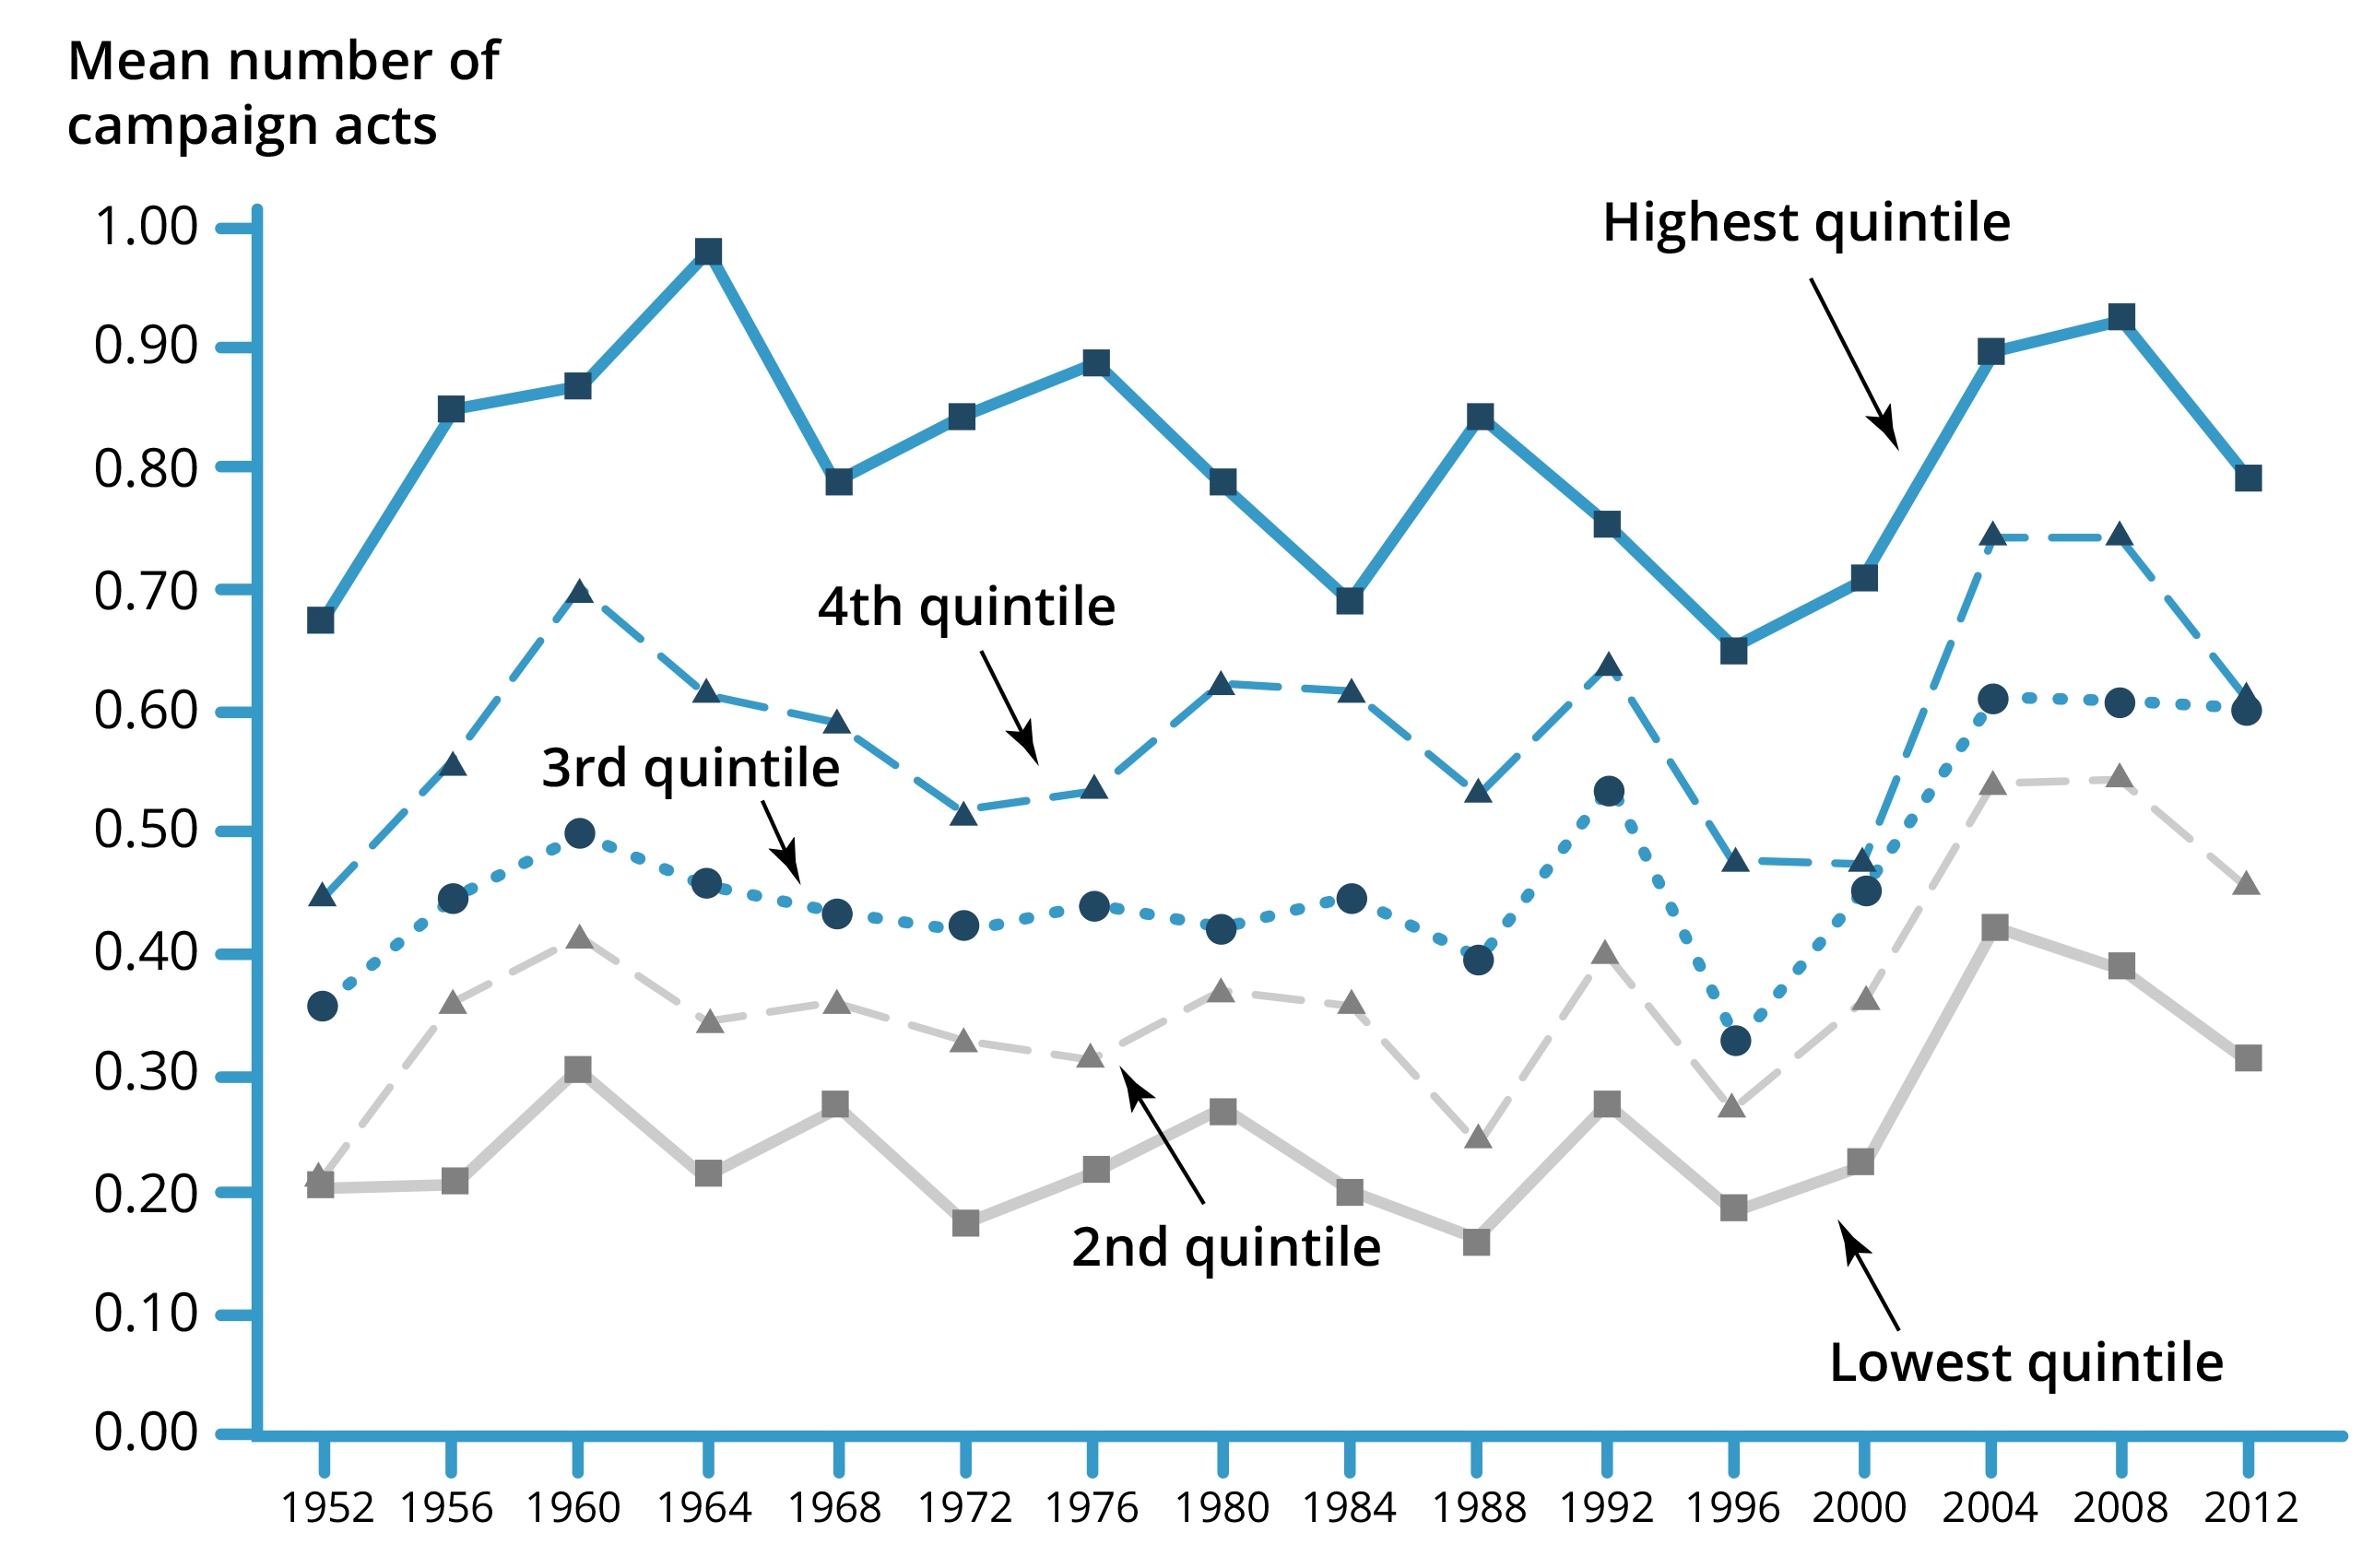
Moving beyond voting to more demanding electoral activities that, at least in cross-sections, are characterized by a higher degree of stratification by social class, the patterns, though different in detail, are roughly similar. Using ANES data for presidential elections over the same period, Figure 3 presents for each SES quintile the mean score on a scale of four campaign activities: working in a campaign, giving money to a campaign, going to a campaign meeting or rally, and trying to influence how someone votes. Consistent with what we saw for voting in Figure 2, the lines for the five SES quintiles array themselves in order from top to bottom and never cross. However, in contrast to voting, the data for the five quintiles move more or less in tandem, and the lines are farther apart. Clearly, the past six decades have witnessed substantial and continuing SES differences in campaign participation.
Figure 3. Persistence of stratification of campaign activity: Mean number of campaign acts over time by SES quintile, 1952–20128Data source: American National Election Studies (ANES) (1952–2012).
Note: Campaign acts: working on a campaign, donating money to a campaign, going to campaign meetings, or trying to influence someone’s vote.
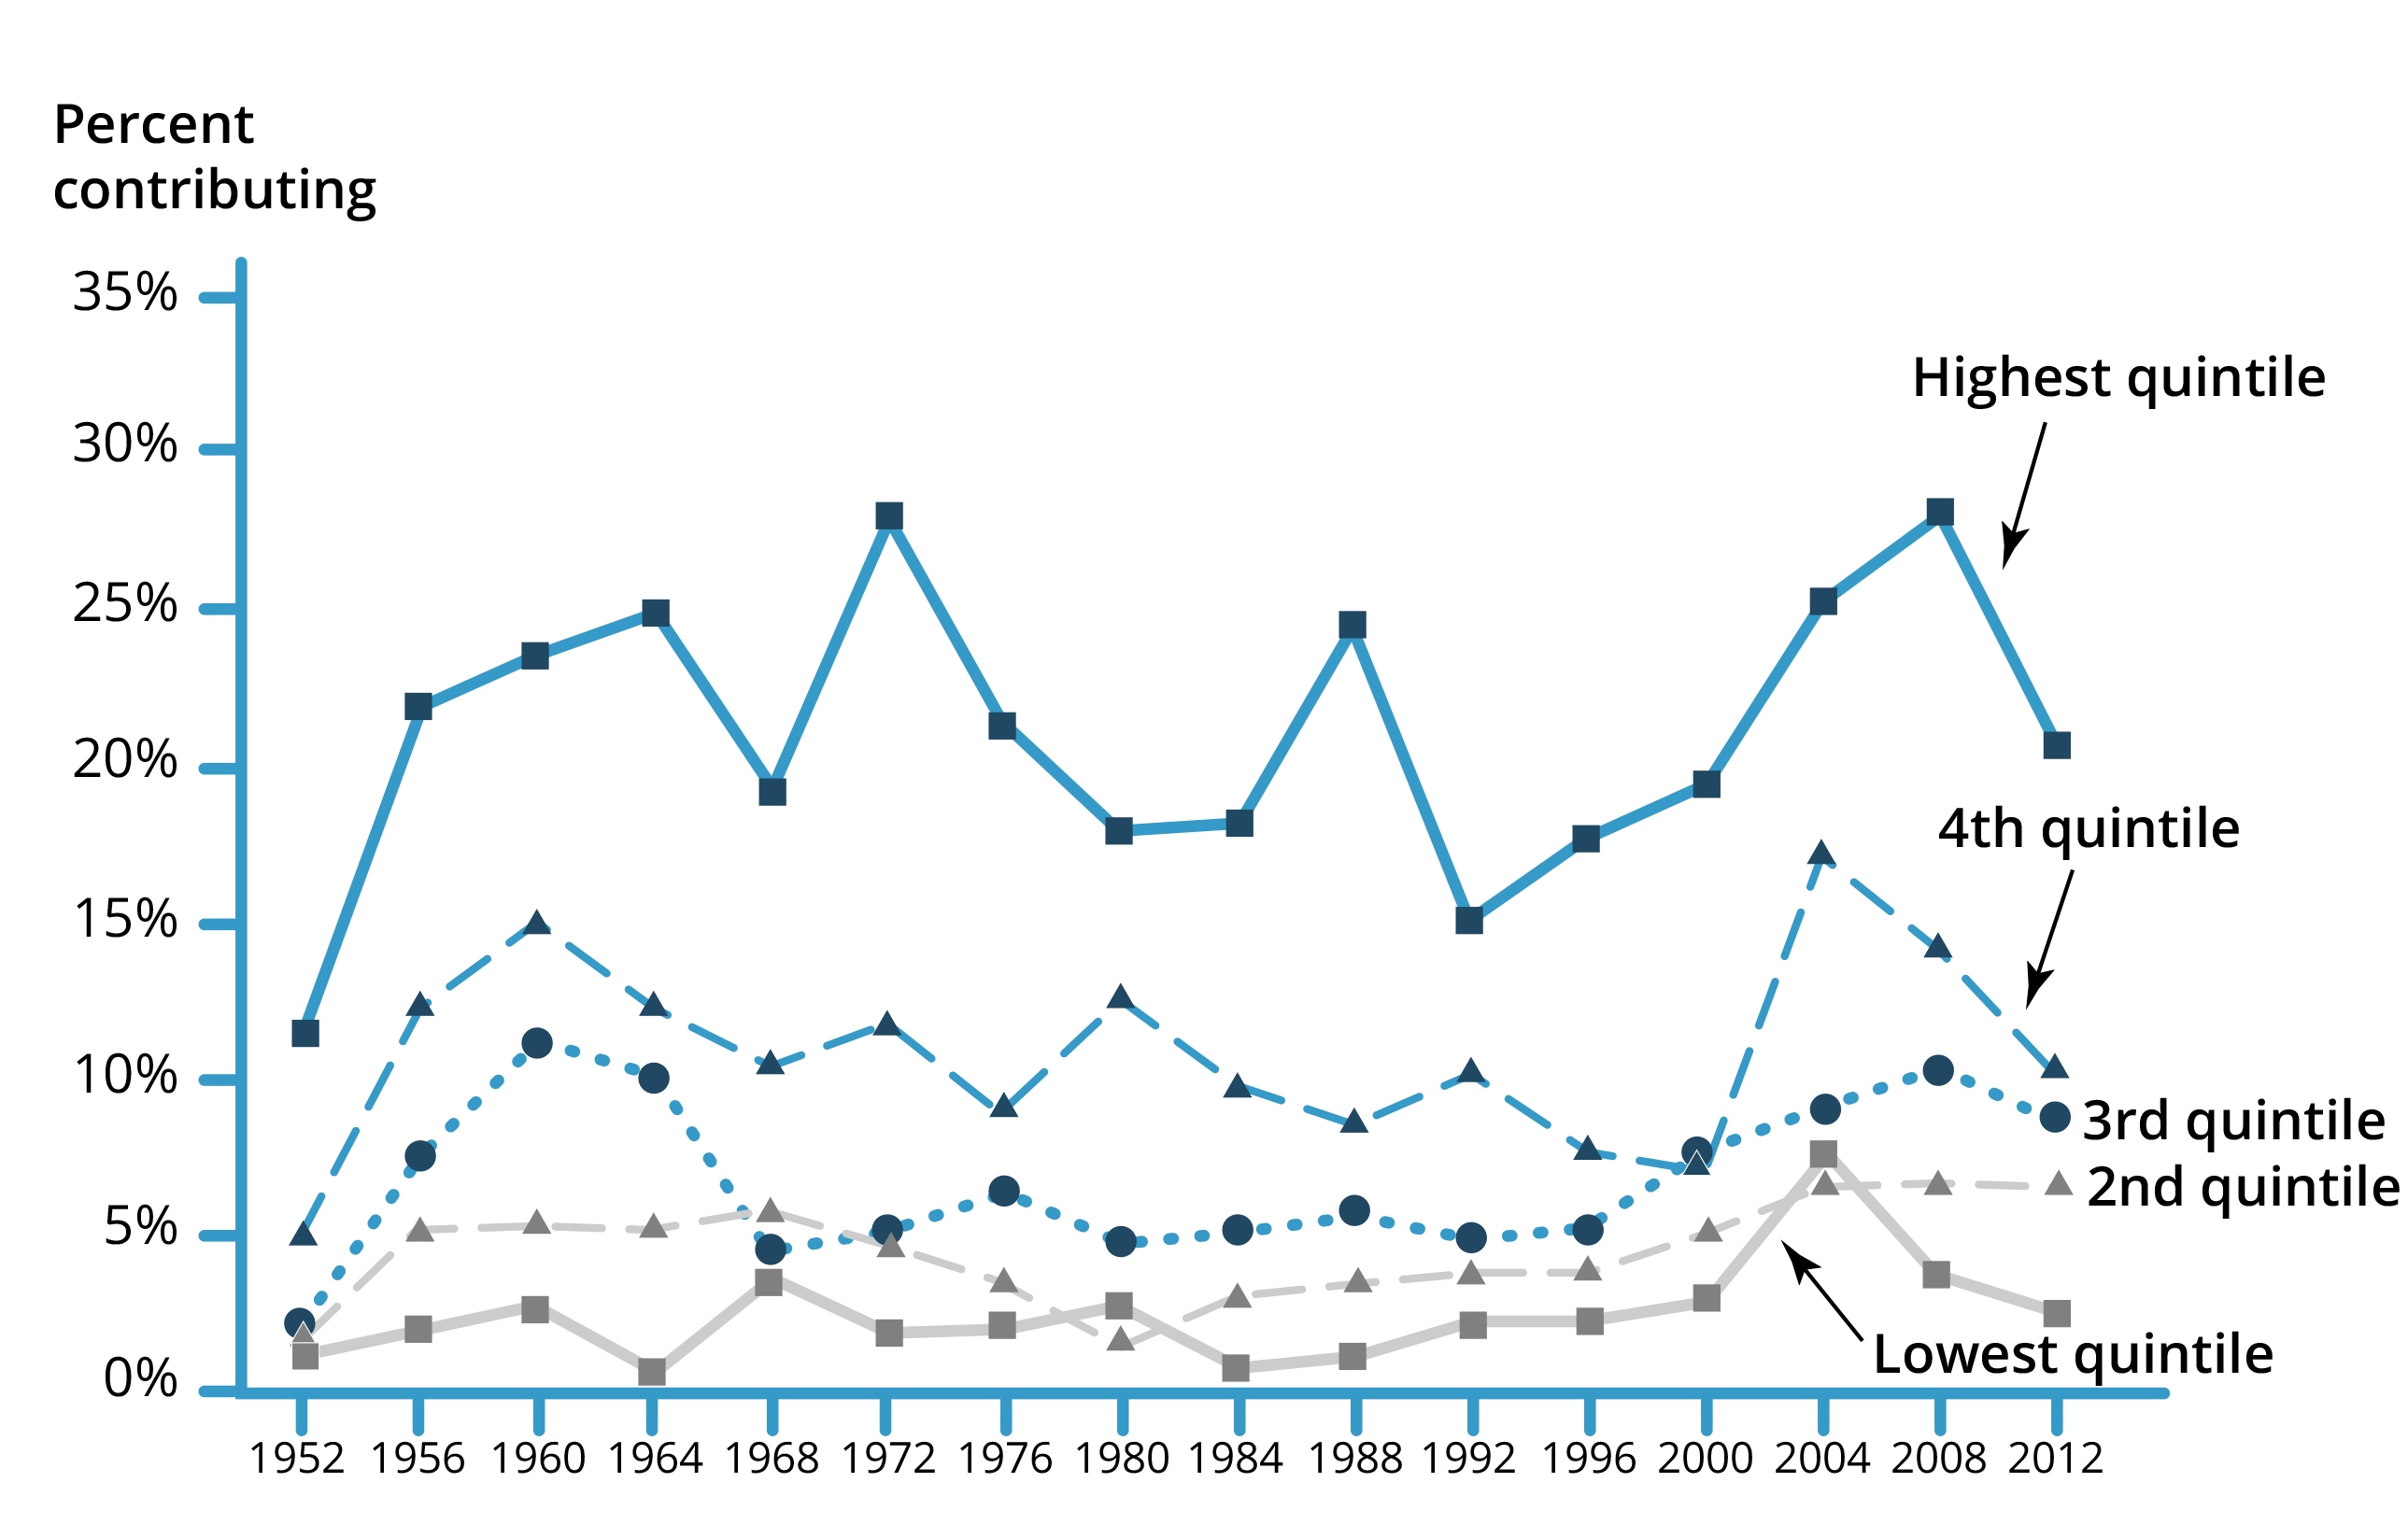
Out of the many ways Americans get involved in electoral politics, giving money is clearly the least egalitarian. In Figure 4 we break apart the scale used in Figure 3 and present data about making contributions to campaigns. Once again, the lines for the SES quintiles array themselves in order from top to bottom and rarely cross; however, the distance between the rates for the highest quintile and the four lower quintiles is noteworthy. Within the top quintile, the proportion making contributions has varied over time, sometimes reaching nearly 30 percent. Within the lowest quintile that share is almost always less than 5 percent. Giving campaign money is, quite obviously, highly stratified and has become more so in the past two decades. Over time, the mix of campaign activities for those with very high SES has shifted, and giving money occupies more space in their participatory bundle.
Figure 4. Contributing to campaigns over time by SES quintile, 1952–20129Data source: American National Election Studies (ANES) (1952–2012.
What about political voice through organized interests?
Americans exercise political voice not only individually but also through organizations. It has long been observed that the set of organizations active in Washington politics tilts sharply in the direction of the advantaged, with strong representation of business and minimal representation of the economic interests of the less well-off. According to data from the Washington Representative Study, in 2011 organizations representing business accounted for 52 percent of organizations active in Washington politics and 77 percent of lobbying spending. With regard to changes in the distribution of active organizations, Table 1 presents the distribution of organizations in the pressure system between 1981 and 2011. On balance, the overall pattern shows a great deal of continuity. Corporations are the modal kind of organization in each of the years for which there are data. Organizations representing broad publics such as unions and the economically disadvantaged, as well as organizations representing people in terms of their shared identities—racial, religious, ethnic, age, gender, and sexual orientation—continue to constitute only a small share of organized interest representation in Washington.
Table 1. The changing distribution of organized interests in Washington politics10Data source: Washington Representatives Study (2011).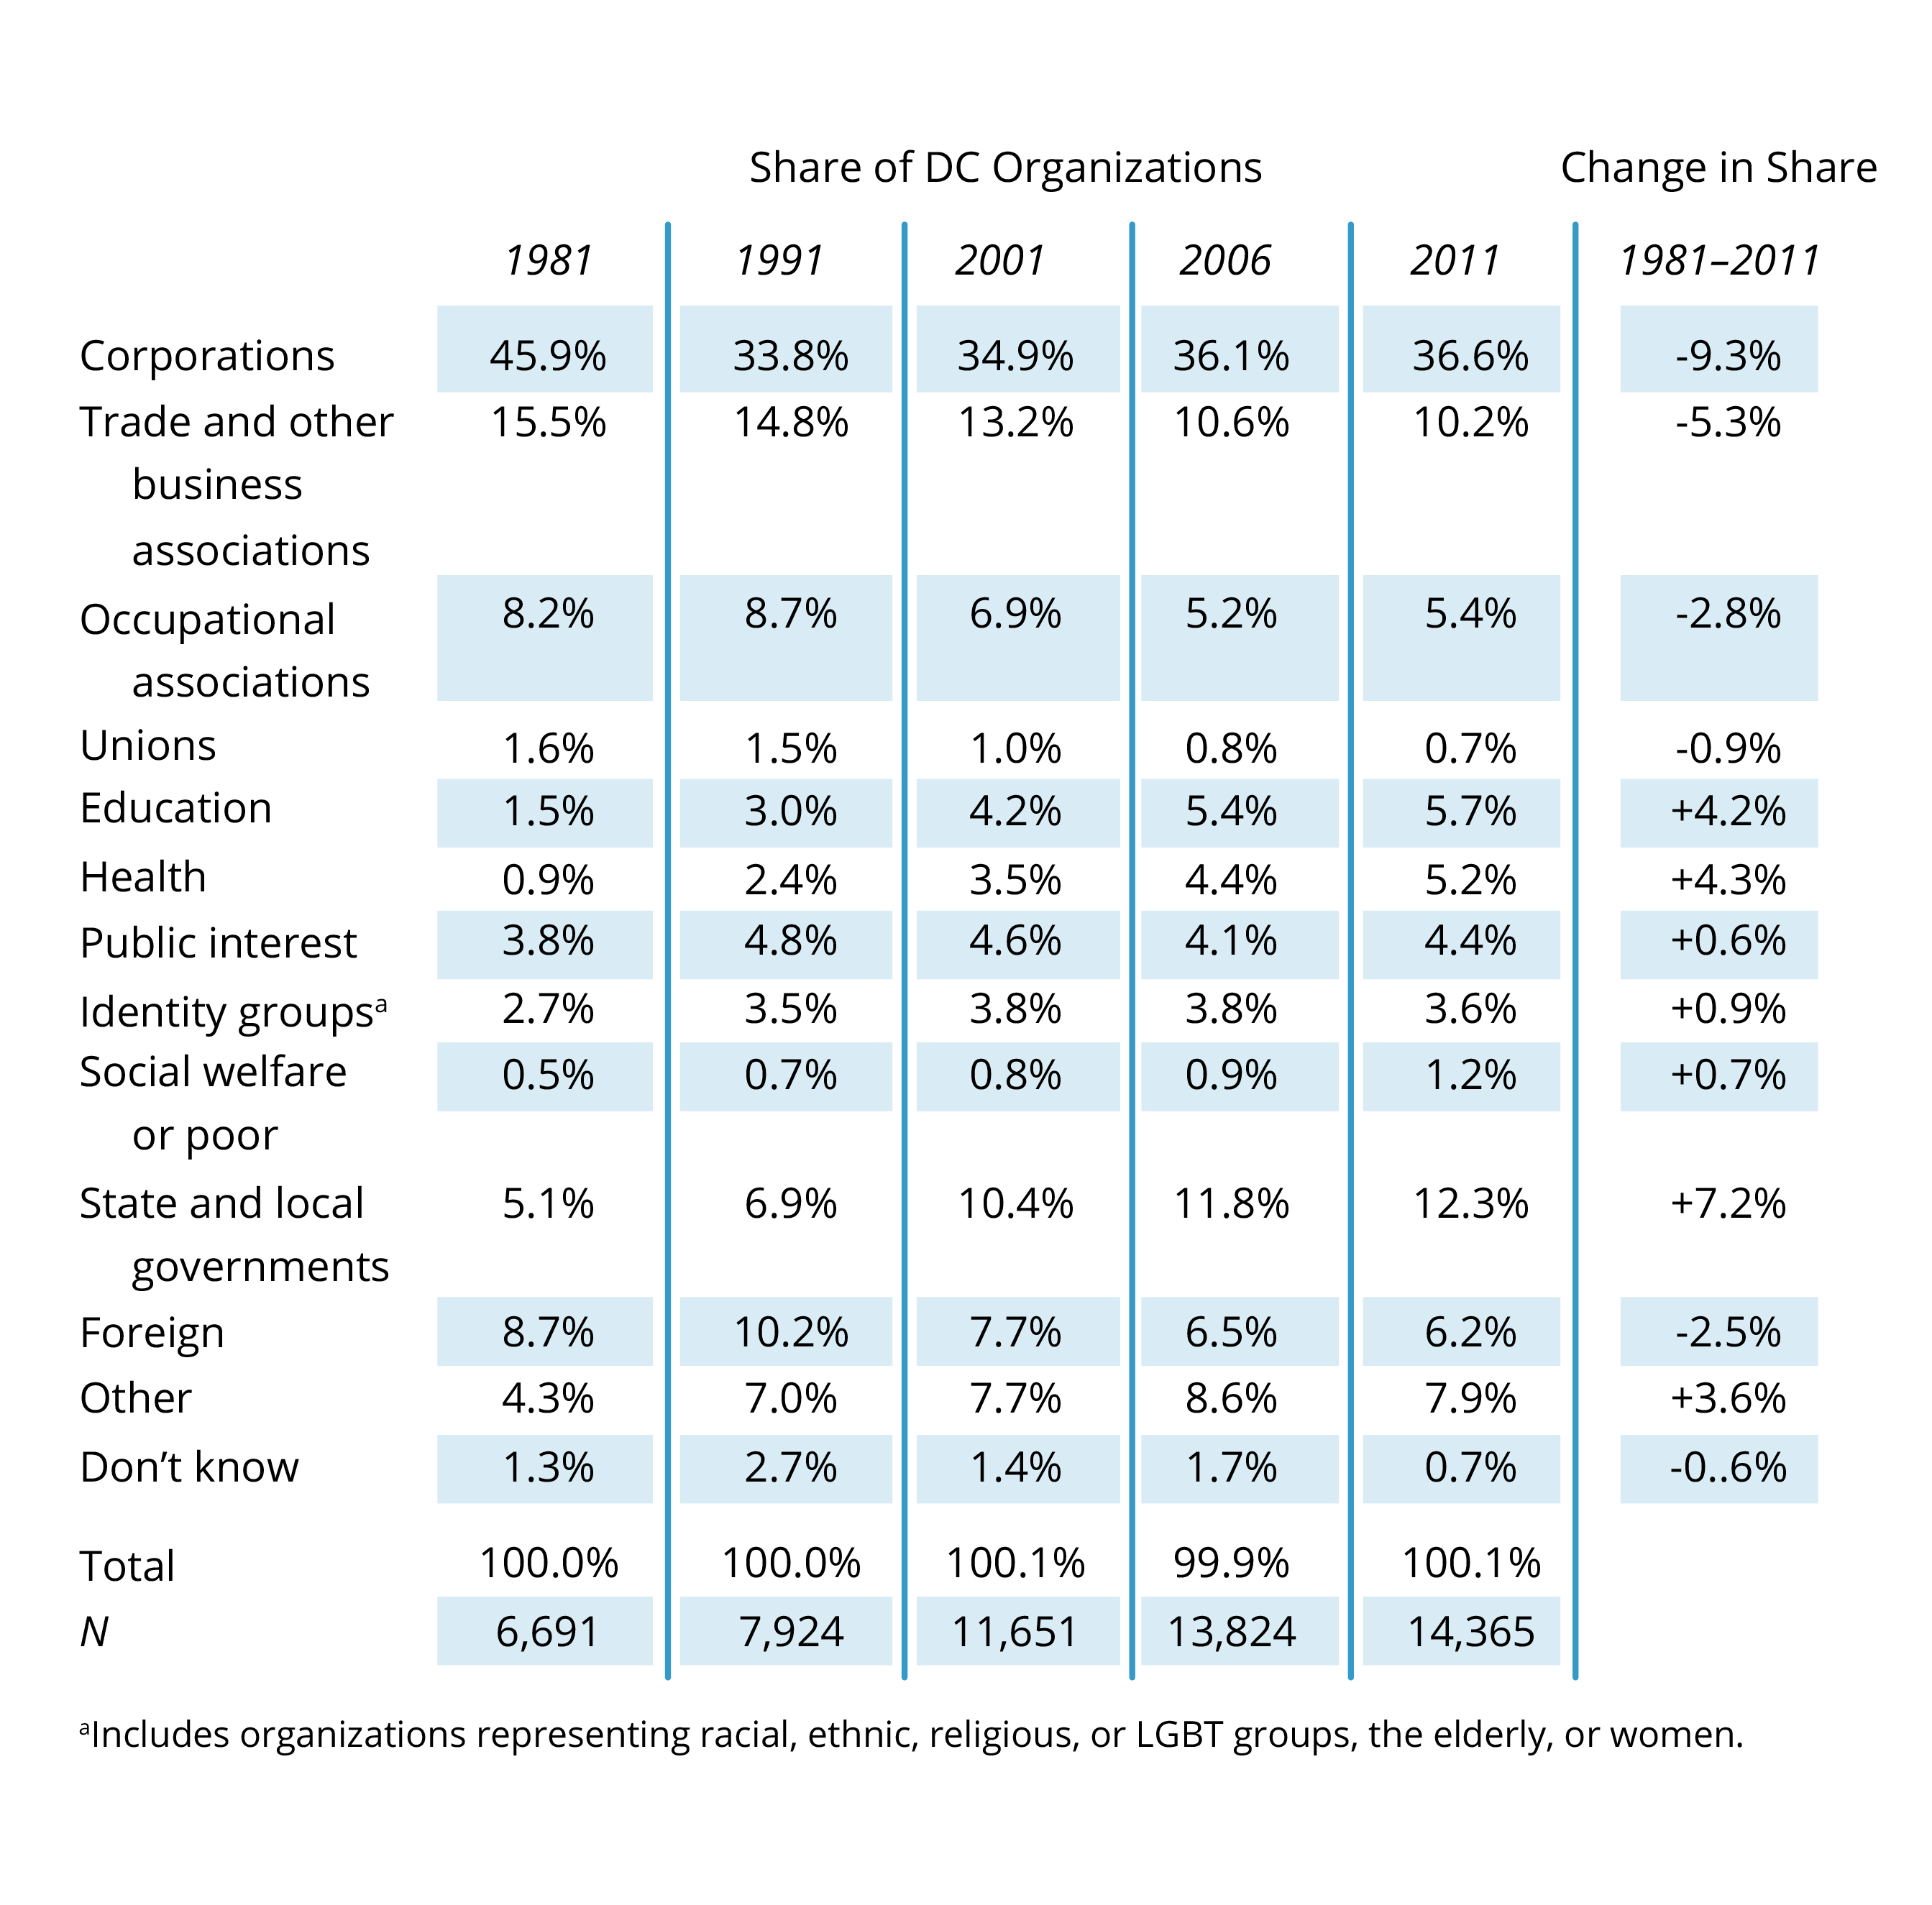
No change in the Gilded Age?
Can we conclude from this evidence that the New Gilded Age has not changed the extent to which political voice is structured by SES? Not so fast. Understanding the overall change in the class bias in political voice requires not only detecting changes in the SES stratification of individual components of political voice but also considering the relative weight of those components in the complex mix of citizen input in politics. Buried in the data about the SES stratification of particular political acts is a process such that certain modes of exercising political voice—in particular, making campaign contributions and activity by organized interests—have increased disproportionately quickly. The result is that forms of activity dependent upon inputs of cash occupy more space in the total bundle of participatory acts.
Consider campaign contributions. Those at the top of the SES hierarchy are much more likely to donate to campaigns than those further down the ladder. However, it is not just who gives but how much. When we weight contributors by the size of their donations, the socioeconomic stratification in campaign giving is much more pronounced. Recent elections have been characterized by spectacular growth in the amounts contributed, a development presumably related to the synergy between recent judicial decisions making it easier to contribute extremely large sums and the existence in the New Gilded Age of a narrow stratum of people who can afford to do so. When campaign giving skyrockets and other forms of individual participation do not, political voice is further stratified in the direction of the affluent.
A parallel argument can be made about organized interest activity, an arena of political voice in which well-compensated professionals commanding extensive experience and expertise in such fields as public relations or law seek political influence. At least until recently, when it seems to have leveled off, organized interest activity has been a growth industry.11For possible explanations for the recent leveling in this growth, and a suggestion as to why that leveling off might be illusory, see Schlozman, Brady, and Verba, Unequal and Unrepresented, 217–218. As shown in the bottom line of Table 1, between 1981 and 2011, the number of organizations active in Washington politics more than doubled, outpacing substantially the increase in population. Furthermore, spending on lobbying rose even faster. Because we have data about lobbying spending only since 1998, we cannot track the whole period. However, between 1998 and 2011, lobbying spending rose sharply—increasing, in inflation-adjusted 2011 dollars, from $2 billion to $3.32 billion.12“Lobbying Database,” Center for Responsive Politics, accessed June 28, 2018, https://www.opensecrets.org/lobby/. In short, organized interest activity figures relatively more importantly among the components of political voice.
“All of these developments have the consequence of further exacerbating inequalities of political voice.”Alone among the categories of organized interests, labor unions did not register an absolute increase in the number of organizations, a result of the absolute decrease in the number of unions that organize private-sector, blue-collar workers. A corollary to this development is that between 1998 and 2012 union spending on lobbying rose only 24 percent while corporate lobbying spending increased 68 percent.13Lee Drutman, The Business of America Is Lobbying (Oxford and New York: Oxford University Press, 2015), 14. These findings dovetail with evidence about the steady decline in both the absolute number and the proportion of private-sector employees who are unionized and the weakening of blue collar voices within the union movement as the share of union members with college degrees has increased. All of these developments have the consequence of further exacerbating inequalities of political voice.
Increasing political inequality in the New Gilded Age
Returning to our friend’s question as to whether we are describing a new and disturbing trend or an old and disturbing process, we can now voice a definitive, “Yes.” On one hand, ever since scholars have viewed it systematically, political voice—whether expressed by individuals or through organizations—has been skewed in the direction of the well-off and well-educated. Our data demonstrate unambiguously the continuation of that trend. On the other hand, the simultaneous explosion in campaign giving and the growth in activity in pressure politics shift the relative weight of forms of political input in favor of those who have financial resources to amplify their voices in politics. Even though the distribution of organizations has not changed appreciably, when combined with the greater weight of campaign giving in the political activity of individuals, the alteration in the balance of individual and organizational voices has exacerbated inequalities of political voice in the New Gilded Age.
References:
Note: The figure shows by SES quintiles the percentage engaging in at least one political act other voting. The data for 1967, 1969, 1990, and 2008 are based on the same five measures of activity: working in a political campaign, contacting a government official, belonging to a political organization, and working with others on a community issue. The data for 1960 are based on a somewhat different set of activities, although ones that closely parallel those used in the other studies.
Note: Campaign acts: working on a campaign, donating money to a campaign, going to campaign meetings, or trying to influence someone’s vote.