“Free agency is over. Layoffs are back. Many of the people losing their jobs are white-collar and college-educated. You could be next.” 1See the full article “White Collar Blues,” by Betsy Morris, at http://www.fortune.com/fortune/careers/articles/0,15114,368503,00.html. (July 23, 2001) —Fortune magazine, July 23, 2001
While academics argue over whether “real” insecurity has increased, Americans’ experience of their economic well-being remains a separate question. Perceptions of risk and insecurity may not match reality. We may be more optimistic or pessimistic than income and employment statistics suggest we should be. At the moment, the popular perception is that we have become a worried nation. Magazines that usually trumpet the virtues of the market have begun to point to the dark side. “The belief that stable jobs would deliver steadily improving living standards has long been one of the major REM cycles of the American dream,” noted Fortune magazine in 1995. “But today a queasy sense of insecurity haunts many working people. From neatly coifed executives to aproned production workers, once secure futures now seem threatened. Wave after wave of corporate restructurings has knocked away the underpinnings of career-long employment that sustained workers’ confidence in their future.” 2See the full article, “Getting Past Economic Insecurity,” by Louis Richman, at http://www.fortune.com/fortune/articles/0,15114,377952,00.html. (April 17, 1995) Is Fortune right? Have waves of corporate change made us motion-sick over declining fortunes?
The answer, in short, is that it depends on the time horizon we pick and the groups we point to. There can be little question that we are an anxious nation today. But looking back over the thirty-year period from 1970 to 2000, we are actually a bit more optimistic than we used to be, at least in aggregate. Of course, aggregates don’t tell us everything we want to know. In particular, they don’t pinpoint which groups feel more uncertain or vulnerable, and which rest with a level degree of insecurity. When we focus on groups defined by income, education or occupation, we find that there are different Americas out there, each with its own understanding of what the future holds economically. Those with less education than a high school degree, for example, have long had to worry about their year-to-year economic stability. And their perceptions of economic security over time reflect this constant stress: they were worried before, and they’re still worried today. But others—college graduates and white-collar professionals, for example—have developed motion sickness only in recent years as their once stable lives come to seem less secure.
An anxious nation?
Political commentator Ruy Teixeira recently observed that America is a “nation of unhappy campers,” citing a Hart Research Associates/AFL-CIO poll that finds 54% of Americans are “worried and concerned” about reaching their economic goals (as compared to 43% who are “hopeful and confident”). 3See Teixeira’s article, “Workers Are Unhappy Campers,” at http://www.motherjones.com/commentary/columns/2005/09/public_opinion_watch.html. (September 2, 2005) The largest source of dissatisfaction is declining real wages and the resulting reduced standard of living; 53% of workers say that their incomes are not keeping up with prices, and 64% of workers worry “very or somewhat often” about prices rising faster than income. These concerns are widespread and seem to affect just about every group: college graduates, high school graduates, white-collar and blue-collar workers. Over 75% of Americans are both dissatisfied with the country’s economic situation and worried about achieving their economic and financial goals. A substantial majority of workers (63%) believe that in today’s economy, it is hard to find “a good job with financial security even with a college degree.” 4The full Hart Research Associates report, “Labor Day 2005: The State of Working America,” is available at http://www.aflcio.org/aboutus/laborday/upload/ld2005_report.pdf.
The picture changes substantially, however, when we extend the time horizon and focus on long term trends. The Index of Consumer Sentiments combines individuals’ reports on their personal financial experience over the last year, their expectations for the next year, and their perception of the national economic climate. 5This is a measure generated by the University of Michigan’s Survey of Consumer Behavior. The index scores range from a high of 108 (in 2000) to a low of 64 (in 1980). While scores have slipped since their historic peak in 2000, the overall trend since the beginning of data collection in 1978 is upward, which suggests we see ourselves as more secure—not less (fig. 1).
The individual indicators that comprise the Index of Consumer Sentiments tell a similar story. For example, while the percentage of Americans reporting in a given year that they are in worse financial shape than the previous year has crept up in the last four years, fewer feel that way now than they did over the 1970-2000 period (fig. 2).
Other surveys confirm these findings. The National Opinion Research Center’s General Social Survey (GSS) asks respondents to rate the likelihood that they will lose their jobs in the year to come. The percent reporting that they were “somewhat likely” or “likely” to be laid off or fired spiked in the early 1980s, the 1990s and post-2001, but the overall time trend since 1977 is virtually flat. On average, then, it would seem that Americans are not plagued with concern over job security today any more than they were in the past (fig. 3). While nearly 50% of all Americans reported to the GSS in 2004 that “finding an equivalent job would be hard,” the data does not suggest a significant time trend.
Multiple American experiences
Before we fold our tent and conclude that all is well—or at least that it is as well as it has ever been—we have to examine exactly which groups have changed and which have remained constant in their estimation of economic insecurity. When we dissect the overall trends, distributing them into groups that differ in income, education and occupation, we can see the differences emerge (fig. 4). 6We also find substantial differences between men’s and women’s perceptions of economic security in the Michigan Survey of Consumer Behavior – women are consistently more anxious than men. The evidence of the gender difference in the General Social Survey is far less clear, however.
Let’s start with income. Americans at the bottom of the income distribution are most likely to think that they are vulnerable to employment and financial insecurity: their views of their personal situation have changed very little since the 1970s. Low-income Americans are not only the most likely to believe they will lose their jobs next year, but also the most likely to report that they are doing worse financially in a given year than in the previous one. As we move up the income ladder, perceived employment and economic insecurity diminish steadily. The one area of economic angst that appears to impact all income groups equally is that of finding an equivalent job: on average over the past three decades, about 40% of individuals in all economic groups report that it would be hard to find a job with equivalent pay and benefits to their current job. In short: while (surprisingly large) portions of each tier of the economic distribution are haunted by the specter of insecurity, those at the bottom of the heap bear the greatest burden of worries.
Education matters as well. The least educated Americans are today (and have been since the late 1970s) far more economically insecure than their better-educated peers. Americans with less than a high school education are the group most likely to report significant employment and financial anxiety. Not only are they are more likely than their better-educated peers to report that job loss within the next year is likely, but they are also most likely to report that finding an equivalent job would be difficult, and most likely to report that their financial situation deteriorated over the last year. As we travel up the education ladder, employment and financial anxiety steadily diminish. While college-educated Americans have always been more secure, on average, than their less-educated peers, they too experience significant levels of anxiety. For example, 33% of college-educated Americans report that finding an equivalent job would be difficult, and 16% reported that their economic situation in a given year was worse than that of the previous year.
Along with income and education, occupational differences predict varying levels of economic insecurity. Given the long, slow erosion of American manufacturing, it is not particularly surprising that “operators and craftsmen”perceive the greatest degree of economic risk. Clerical and service workers are marginally more secure, while professional and technical workers and mangers enjoy the highest levels of security. While 15% of operators and craftsmen believed job loss in the next year was likely, only 7% of managers worried about losing their jobs. Similar differences between occupational groups exist for perceived difficulty of finding an equivalent job, and for the percentage reporting a worse financial situation this year than last. White-collar workers, in general, feel more security in their economic position than do their blue- and pink-collar peers.
Rising angst in the winner’s circle
These variations between groups—by education, income and occupation—have persisted over the last three decades. But while some have held steady in their perceptions, others have seen their worries grow sharply. Indeed, a change for the worse has been most pronounced in the group we might expect to be most secure: the economic winners, college-educated Americans and managers.
When asked whether they were likely to lose their jobs in the next ten years, an increasing proportion of college graduates have answered “yes” over the last thirty years (fig. 5). They have become somewhat more optimistic about the potential for finding an equivalent job, despite a recent spike in concern (fig. 6), but the same cannot be said for financial well-being. The percentage of individuals who says that they did worse financially in a given year than in the previous year has crept upward. While a college education provides greater security than those with less education can hope to have, the blanket is fraying at the edges.
American managers seem to be less happy campers as well. Since the late 1970s, managerial workers have increasingly reported that they think they are going to lose their jobs in the year to come. 1991 and 2002 were particularly bad years—nearly 16% of all managers reported likely job loss in both (fig. 8). They don’t seem to have changed in their sense of how easy it will be to find an equivalent new job, but they have definitely seen a decline in their financial security, with 1991 and 2002 standing out as bad years. Nearly 35% of all managers reported that they did worse financially in 1991 and 2002 than in 1990 and 2001, respectively (fig. 9). In general, the percentage of American managers who report doing worse financially in a given year than in the previous one has increased over the last three decades.
Squaring perceptions with “reality”
Do Americans have it right? Are their expectations for economic or employment security “on the money” or off the mark? A quick review of the data on income and employment suggests that they have a pretty good fix on the situation.
Aggregate opinion holds that insecurity has waned; that tracks the data we have fairly well. For instance, although counter-cyclic, job loss became less common between 1981 and 2001 (fig. 10). During that same period, workers who lost their jobs were more likely to find new work (fig. 11). The one exception to this generally positive picture is the toll that unemployment took on displaced workers. Those who take new positions following the loss of a job suffer a significant pay cut. Apart from the welcome spike that we saw in the boom years of the late 1990s, re-employed workers have endured weekly earnings losses of at least 10% since the 1980s, with the most recent data (from 2001) suggesting even deeper cuts (fig. 12). 7All trends and figures here are drawn from Henry Farber’s 2003 working paper,“Job Loss in the United States, 1981-2001.” See http://www.nber.org for NBER Working Paper No. 9707.
What about the different groups we have examined, defined by income or education? It seems that each of them has a pretty good handle on what they should expect, compared to the fact pattern. The relative optimism of higher income Americans as compared to their lower-income peers makes sense. Household income for the top fifth of the income distribution has skyrocketed, while household income for the bottom fifth of the distribution has actually decreased (fig. 13). 8The trends and figures reported here are from Jared Bernstein, Lawrence Mishel and Chauna Brocht’s “Any Way You Cut It: Income Inequality on the Rise Regardless of How It’s Measured,” a briefing paper from the Economic Policy Institute in 2000. See http://epinet.org. As such, the comparatively rosy perceptions of economic security among the wealthiest Americans mesh well with the aggregate economic trends. And the glum outlook of America’s poor is on-target too.
The anxiety of less-educated workers compared to that of their more-educated peers mirrors the graduated experiences of these groups in the labor market. The least-educated are the most likely to lose their jobs and the least likely to be reemployed, and that has been the norm over the last two decades (fig. 14, fig.15). The toll suffered by displaced workers is somewhat different, however (fig. 16). In the 1980s, the least-educated unemployed fared worst, suffering greater proportional losses to their earnings upon reemployment than their more educated counterparts. By the 1990s, however, this situation had reversed. Upon reemployment, the least-educated workers now lose less than their better-educated peers. Of course, given the well-documented decline in the fortunes of America’s least educated workers, it is probably the case that the jobs they are losing pay so poorly that they are not likely to lose a great deal even if they can find new jobs. 9For a synthesis of the declining earning power of the least-educated Americans, see David Card and John DiNardo’s 2002 article, “Skill-Biased Technological Change and Rising Wage Inequality: Some Puzzles and Problems” in Journal of Labor Economics 20(4): 733-783. Losing a job flipping burgers and finding a new one as a parking lot attendant may not mean much of a pay cut, but it certainly doesn’t mean things are looking up either.
The hand-wringers in the winners’ circle have good reason for their nervousness. 10Unfortunately, we are not able to provide a breakdown of the economic trends by occupation for this paper, although we anticipate investigating this perception/reality match-up further in future work. The rate of job loss amongst America’s most educated—those with a college degree (or at least 16 years of education)—has increased more steeply than the rate of job loss amongst the less-educated. By 2001, job loss amongst the most educated was at a 20-year high of 11%. Reemployment for college-educated Americans has become more and more difficult, and the post-1990s bust appears to have hit this group particularly hard. And college-educated job-losers face the steepest financial penalties, as the earnings losses associated with taking a new job following unemployment have risen substantially over the last few decades. By 2001, a college-educated worker could expect to earn about 23% less in her new job than she did at the lost job.
In sum, Americans know what they are talking about when it comes to employment and economic security.
Rising Risk?
The promise of opportunity and upward mobility has long been a bedrock expectation in the U.S. In general, that optimism has stayed with us over time. Yet underneath the optimistic gloss lie the demons of risk and the potential for a tumble down the rungs of the economic ladder.
Those at the bottom of the ladder have always been the most concerned about their economic stability—the sizable percentage of lower-income and less-well-educated Americans who report unease over their job stability, their prospects for reemployment, and their economic well-being suggest that the American Dream rings hollow for some.
Moreover, rising levels of insecurity amongst those who have “made it” suggest that the American Dream is under a lot of pressure. When college-educated Americans and managerial professionals express greater concern for their security, America listens. They vote. Moreover, the power of their voice is magnified by what they represent. If the most advantaged among us are lying awake at night, thinking about how to cover their bills or whether they will have a job next year, what hope is there for the millions of others who lack their credentials and savings accounts?
Figure 1
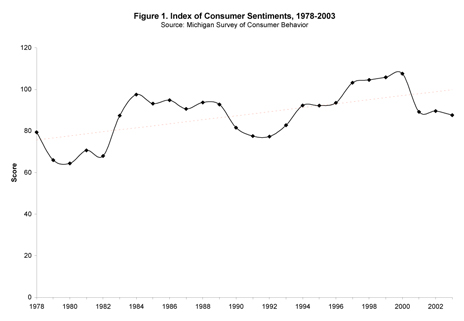
Figure 2
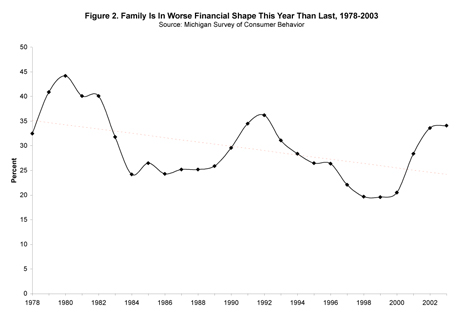
Figure 3
Figure 4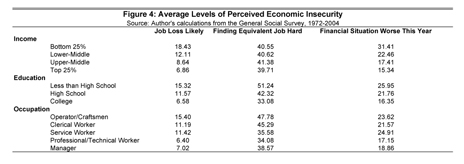
Figure 5
Figure 6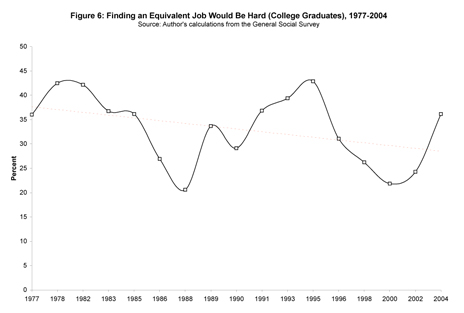
Figure 7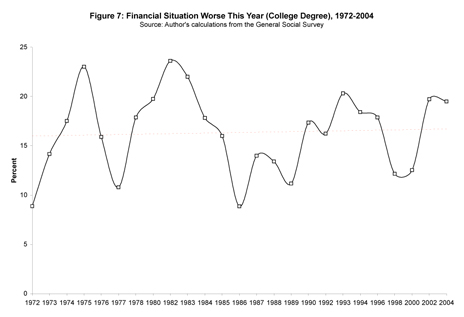
Figure 8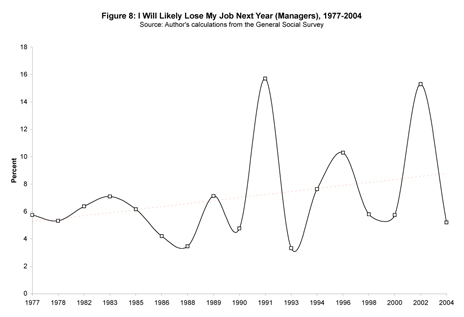
Figure 9
Figure 10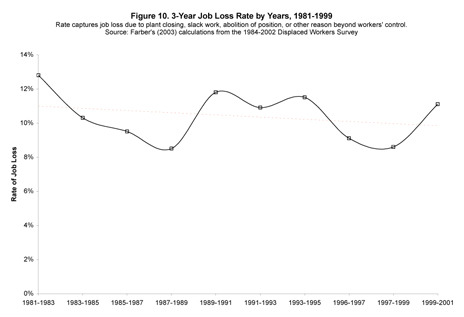
Figure 11
Figure 12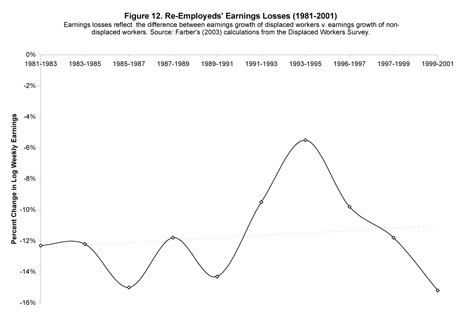
Figure 13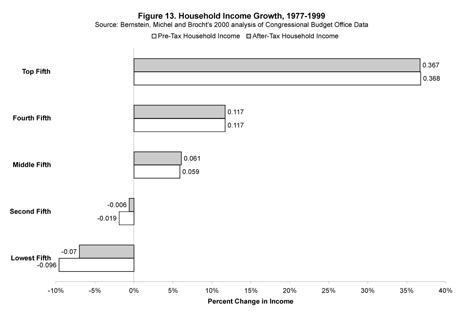
Figure 14
Figure 15
Figure 16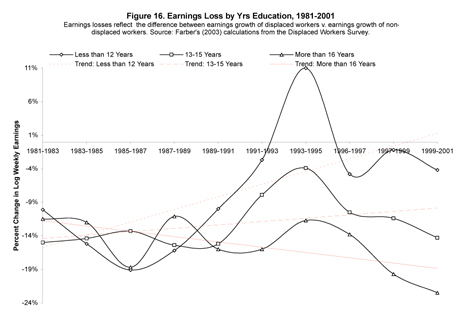
Elisabeth Jacobs is a graduate student in sociology at Harvard University. She also spent several years in New York City conducting policy research and advocacy on a wide range of domestic and local policy issues with the Brennan Center for Justice at the NYU School of Law and at the Howard Samuels Center at CUNY’s Graduate Center.
Katherine Newman is professor of sociology and international affairs at the Woodrow Wilson School at Princeton University. She has previously taught at Columbia, Berkeley, and Harvard where she founded the doctoral program in sociology and social policy. Her interests lie in the qualitative study of social stratification, with a special emphasis on the cultural meaning of mobility, work, poverty, and violence.