Influential voices in the media and in public policy circles have sustained the impression and perhaps heightened the concern that high levels of immigration harm resident Americans by reducing their wages. This perception of “labour market flooding” – sometimes billed as “common sense” (Brimelow, 1995) – is bolstered by the logic of introductory-level microeconomic theory. That analysis begins by assuming a static labor market in which an increase in the supply of labor from immigration will lower the wage employers will offer. Immigration economist, George Borjas, emphasized this logic in the title of a recent paper, “The Labor Demand Curve Is Downward Sloping” (Borjas, 2003), which refers to the graphic representation of this abstract labor market model.
Nonetheless, an impressive number of empirical studies based on recent data find no evidence of a negative impact of immigration on resident wages. At the conclusion of a survey of the literature published in 1995, Rachel M. Friedberg and Jennifer Hunt report:
Despite the popular belief that immigrants have a large adverse impact on the wages and employment opportunities of the native-born population, the literature on this question does not provide much support for this conclusion. … [E]mpirical estimates in a variety of settings and using a variety of approaches have shown that the effect of immigration on the labor market outcomes of natives is small. There is no evidence of economically significant reductions in native employment. Most empirical analysis of the United States and other countries finds that a 10 percent increase in the fraction of immigrants in the population reduces native wages by at most 1 percent (Friedberg and Hunt 1995: p. 42).1This summary refers in particular to a series of studies reported by the National Bureau of Economic Research (NBER). See Robert LaLonde and Robert Topel (1991) and Joseph Altonji and David Card (1991). In summarizing the NBER research effort John Abowd and Richard Freeman reported that the “broad implication is that immigrants have been absorbed into the American labor market with little adverse effect on natives” (Abowd and Freeman, 1991: 22). A National Research Council Panel convened by the U.S. Commission on Immigration Reform reached the same conclusion (Smith and Edmonston 1997: 219-220). See Card (2005) and Gianmarco Ottaviano and Giovanni Peri (2005, 2006) for recent contributions that bolster the conclusion that the impact of immigration on the wages of competing native-born workers is small.
Yet immigration’s impact on wages and employment is extremely difficult to measure. This is why the debate continues. Several well-known economists, with Borjas prominent among them, contend that immigration reduces the economic well-being of residents (Borjas 1995, 1999a, 2003). The negative effect of immigration is hidden, they suggest, because native-born workers respond to the arrival of immigrants by moving elsewhere, “voting with their feet” (Borjas 1999b: 1740).
In this view immigrants “crowd out” native workers who flee to areas less impacted by immigration. Indeed, if every arriving immigrant worker inspired one resident departure, total employment in the local market and therefore the wage would remain unchanged. The residents’ departure disperses the immigrants’ wage-depressing effect across the entire economy where it is difficult to detect precisely because it is pervasive. Therefore the question of the wage effects of immigration is intimately related to the locational choices of foreign and native workers.
The empirical evidence on this “crowding out” hypothesis for the modern period is mixed and no consensus has been reached. Investigating data for the 1970s and 1980s, Randall Filer (1992), Borjas (2001) and several others find a negative relationship between immigration (or net immigration) and out-migration of resident workers. Research by Michael White and Yoshie Imai (1994), Richard Wright, Mark Ellis, and Michael Reibel (1997), David Card (2001), and Mary Kritz and Douglas Gurak (2001) found either no relationship between the entry of immigrants and the exit of the native-born or a positive one; that is, both immigrants and the native-born moved to the same cities. Because the question of harm is, in Borjas’ words, “at the core of the immigration debate” (Borjas 1999a: 62-63), the issues of locational adjustment and wage effects remain hotly contested within the economics profession.2See Roger Lowenstein (2006) for an accessible account of the debate. Kritz and Gurak, in a review of this debate, suggest that the confusing results reported in the literature are a product of different model specifications, different populations studied, different regions, and different time periods chosen for analysis (Kritz and Gurak 2001: 134-135).3 Another problem is that some of the findings are driven by two significant outliers: Los Angeles and New York City. Both cities are major ports of entry for new immigrants even today.
This essay attempts a fresh empirical look at the economic consequences of immigration with particular attention to the argument that native-born workers are pushed out of labour markets flooded by foreign workers. Our approach shifts attention away from the recent experience to the decades centred on the centennial year 1900. There are several reasons for thinking that an examination of this historical “Age of Mass Migration” may prove helpful. During that period immigration flows were considerably heavier than they are today, especially when compared with the size of the resident population. If a negative impact of immigration is hard to find in modern data, perhaps it will reveal itself during a period of much more intense labour market pressure. Second, most of the economists who argue that there ought to be significant negative impacts of immigration have taken a short-run, static point of view and thus have assumed away any relationships between immigration, structural changes, and economic growth. If the objective is to measure the net effect of immigration, not just the partial short-term impact, then one needs to take a longer historical perspective.
Two widely-cited studies, one by Claudia Goldin and the other by Timothy Hatton and Jeffrey Williamson, conclude that the mass immigrant arrivals during the “Age of Mass Migration” exerted strong downward pressure on the earnings of resident workers. Goldin reports, “wages were depressed in cities having an increase from 1899 to 1909 in the percentage of their populations that was foreign born” and “the results are even more supportive of the view that immigration severely depressed the wages of less-skilled labor” (Goldin 1994: 252). Hatton and Williamson conclude that “a 1 percent rise in the labor force due to immigration would have reduced the real wage in the long run by 0.4 percent … or 0.5 percent” (Hatton and Williamson 1998: 172). Hatton and Williamson also report that crowding out was a significant phenomenon between 1880 and 1910, presumably as natives fled the regions that were attracting the immigrants because the wages in those labour markets fell in response to labour market flooding. Given the large magnitude of the immigrant flows, the age and skill mix of the immigrants relative to the existing population, and the less-structured character of the American labour market at that time, these conclusions are certainly plausible.
But are they correct? A dynamic historical analysis, such as that offered by historians and theorists of economic growth, suggests not. A long-term historical perspective indicates that, even though immigration may somewhat slow the rate of growth in wages, it also has a stabilizing effect in sustaining growth by raising levels of consumption and investment and by differentially expanding labour supply to the dynamic sectors of the economy.
Modeling the impacts of immigration
Economic analyses of the consequences of immigration usually take as their starting point a static model of the labour market. In the simplest version of this model, labour is assumed to be homogenous in its productivity and other relevant characteristics so that immigrant and native-born labourers are perfect substitutes.
According to this model, demand is assumed to be unaffected by immigration itself. Thus, for example, the analysis ignores the impact of immigrants in increasing demand for final products. It assumes an economy that is closed to trade with other regions so that an inflow of immigrants cannot lead to an increase in the production of traded goods or an in- or out-migration of resident labour. The increase in labour relative to capital is not allowed to stimulate an inflow of capital or the adoption of new production techniques. We will return to relax these restrictive assumptions later. Our discussion of this simple version is intended, not as a straw man, but as a starting point for discussing our analytical framework.
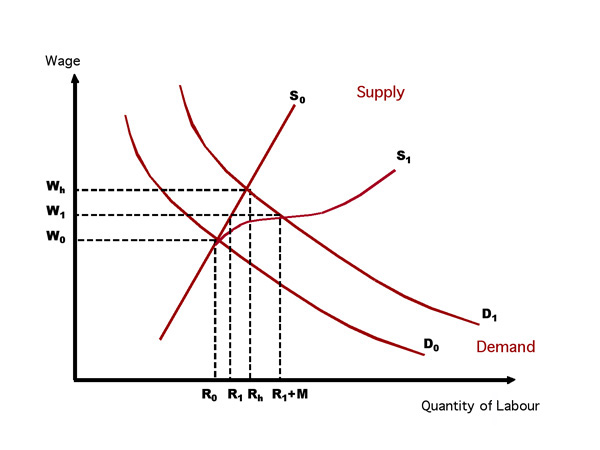
Figure 1: The Textbook Economy
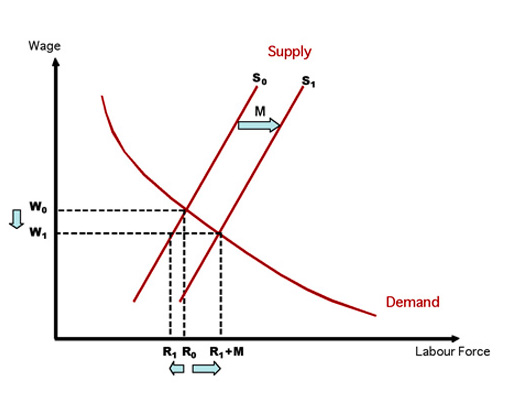
Figure 1 presents the familiar graphical analysis which we have labeled the “Textbook Economy” model. Before immigration, the labour supply curve is S0. Together with the demand curve, it establishes an equilibrium wage of W0 and a quantity of resident labour hired of R0. If a flow of immigrant workers equal to M arrives, the supply curve for labour is pushed to the right as shown by S1. Here it is assumed that the supply of immigrant labour is perfectly inelastic, that is, wages do not influence the amount of immigrant labour supplied. The outward shift of the labour supply curve lowers the equilibrium wage to W1, reduces the employment of residents from R0 to R1, and increases total employment to R1+M. The model assumes “full employment,” so the decline in resident employment is due to the voluntary withdrawal of labour services by residents unwilling to put forth the same effort at the reduced wage.
As students of the subject know, however, the presence of immigrants is often associated with high, not low wages. For example, when Friedberg and Hunt plot the average wage and salary income of the 30 largest cities in the United States in 1990 against the fraction of those cities’ population that is foreign-born they find that “cities with higher immigrant densities also have higher mean incomes.” In a study of the American economy a century earlier, Goldin also found a strong positive relationship between the fraction of a city’s population that was foreign-born and the city’s average wage (Goldin 1994: 247).
There is another prediction of the simple model that fails the empirical test. Real wages in sectors that employed a large and growing number of immigrants during America’s Age of Mass Migration did not fall over time; they rose. Real wages at the end of the period were higher than at the beginning despite the influx of immigrants.4The simple model assumes one type of labour. Data reported here are averages across a variety of labour types. These averages are affected not only by the wage paid to each category of labour, but also by the relative share of the different occupations in the total. The impact of shifting relative shares on the average is called the “composition effect.” Since immigrants earned lower wages than the native-born, the growth of the immigrant share of the labour force would be expected to lower the average wage. Indeed, as the immigrant share of the labour force grew, it is theoretically possible for the overall wage to fall even when the wages of both the native-born and the immigrants were rising. That the average rose despite the negative composition effects, means even stronger wage gains for immigrants, natives, or both, than trends in the average wage suggest.
So what explains the failure of the straightforward predictions of the textbook model to accord with the facts? As we have noted, one explanation may be native flight or “crowding out.” This view takes as a starting assumption the notion that before the arrival of new immigrants the regional labour markets are in a country-wide equilibrium with an identical wage (after adjustments for particular regional conditions) prevailing in all markets. Thus the arrival of immigrants would push the local wage below the national level, inducing some residents of the impacted market to move to another area. In doing so, they restore a national equilibrium. This explanation is favoured by Hatton and Williamson (1998, Figure 8.4: 166). They relax the textbook assumption that native workers are confined to the local market and postulate as a consequence a highly elastic supply of resident labour.
Locational choices of immigrants and natives: State-level analysis
Hatton and Williamson are particularly concerned with the possibility of crowding out. They estimate that,
… an additional 100 foreign-born in-migrants to these northeastern states increased native-born out-migration by 40. While this is not quite the one-for-one Filer found for late-twentieth century America …, it is substantial crowding-out nonetheless” (Hatton and Williamson, 1998: 168-169 citing Randall Filer 1992).
Hatton and Williamson’s conclusions are based on an analysis of data assembled by Hope Eldridge and Dorothy Swaine Thomas (1964) from the decennial censuses. Hatton and Williamson focus on the three decades beginning in 1880. To identify possible crowding out, they begin by comparing regional differences in net native- and foreign-born in-migration rates calculated as a share of the native population. They call attention to three different regional patterns: (1) in the Northeast, low (but non-negligible) rates of native out-migration coupled with high rates of foreign in-migration; (2) in the South, high rates of native out-migration coupled with very low rates of foreign in-migration; and (3) in the West, large inflows of both the native- and the foreign-born. Hatton and Williamson concede that there was no crowding-out in the South or the West. Few immigrants were going to the South, so they could not be the reason for native departures. Both natives and immigrants were going West in large numbers, so immigrants do not appear to have thwarted the natives’ westward march. If crowding out occurred, it would have to be in the populous 14 states of the Northeast that were attracting large numbers of immigrants while at the same time losing many of their native-born. It is to states in this region that the Hatton-Williamson crowding-out results reported above apply. Here we review their evidence.
Figure 2: Hatton and Williamson’s Test of Crowding Out5 Note: The rates graphed are the decadal average annual net migrant flows divided by the average native-born population. The state names are indicated by a two-letter code. The plot for Wisconsin is the small dot partially hidden by the plotted observation for New Hampshire. Source: Eldridge and Thomas 1964: Tables A1.11, A1.12, and A1.14.
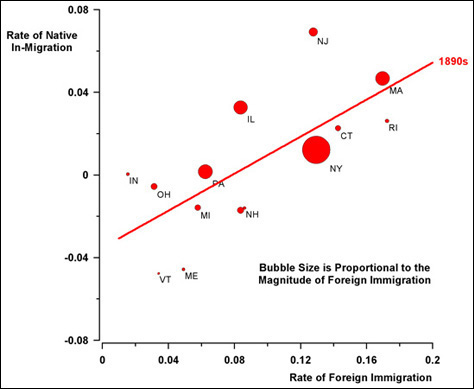
Figure 2 plots for each state the net migration rates of the native- and foreign-born for the 1890s.6The data for other decades is qualitatively similar. The correlation coefficients between native- and foreign-born net migrations are 0.64, 0.70, and 0.77 for the decades of the 1880s, 1890s, and 1900s, respectively. Only Wisconsin in the 1880s displayed migration patterns consistent with possible crowding-out. In that decade an 18.7 percent immigration rate was associated with an 8.2 percent outflow of the native born. The surprise, in seeming contradiction to the conclusions presented by Hatton and Williamson, is the positive correlation between native- and foreign-born migration rates. That is, states experiencing the largest exoduses of the native born – Vermont, Maine, New Hampshire, Michigan, and (hidden just to the upper right of New Hampshire) Wisconsin – reported very small inflows of foreign-born. Immigrant inflows were less than one percent of the resident population. While on balance more native-born left these states than entered, crowding-out by foreigners does not appear to explain the exodus. More likely, the native-born left because of the poor state of New England agriculture and the attractive agricultural opportunities out West (Barron 1984). States with the heaviest inflows of the foreign-born – Rhode Island, Massachusetts, Connecticut, New York, and New Jersey – on the other hand were also attracting the native-born migrants.
Figure 3: Immigrant Magnet Counties, 1900-1910 7Note: All 318 counties with an increase in the foreign-born population (aged 10 and older in 1910) equal to or greater than 1,000 are indicated. The bubble size is proportionate to the numerical increase in the foreign-born with New York and Kings Counties in New York State the largest with increases of 362 and 195 thousand respectively followed by Cook County, Illinois (the site of Chicago with 193 thousand), and Philadelphia County, Pennsylvania (75 thousand). Source: Haines 2004 and authors’ calculations.
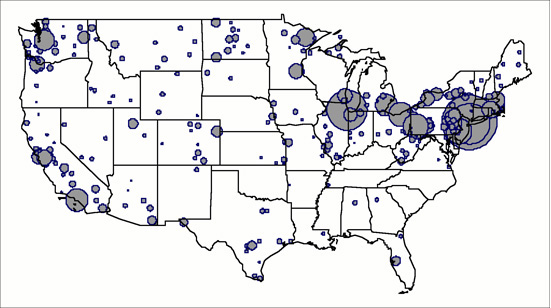
Figure 3 identifies what we call “Immigrant Magnet Counties.” These are the 318 counties that experienced a net increase of 1,000 or more immigrants over the decade. Bubble size is proportional to the numerical increase. It is clear from the figure that immigrants disproportionately settled in the industrial counties of the Northeast and Midwest and, to a lesser extent, along the Pacific coast.
Of the 318 “Immigrant Magnet Counties” depicted in Figure 3, 72 percent experienced a positive inflow of both foreign-born immigrants and native in-migrants. Figure 4 presents a log-log scatter diagram that plots each of the magnet counties in a manner designed to illustrate the relationship between the total net in-migration (native and foreign born) and the net increase in the foreign-born population. The 45-degree line represents the locus of points where the increase in the foreign-born and the total in-migration are the same. Counties plotted above the 45-degree line experienced a net in-migration of both the native- and foreign-born. Counties below the 45-degree line experienced a net in-migration of foreign-born and an offsetting net out-migration of native born.
Figure 4: Total Net In-Migration and the Increase in the Foreign-Born Population, 1900-19108Note: All 318 counties with an increase in the foreign-born population (aged 10 and older in 1910) equal to or greater than 1,000 are indicated. The bubble size is proportionate to the rate of foreign immigration. All counties above the straight line experienced both foreign immigration and native in-migration. Those below experienced native departures. Source: Haines 2004 and authors’ calculations.
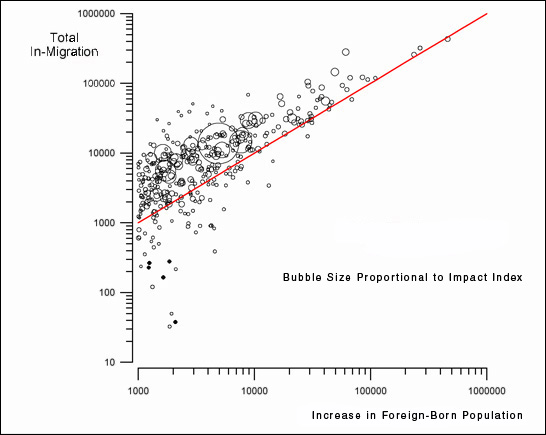
We suggest that the pattern displayed in Figure 4 is not consistent with an interpretation that the counties below the line exhibited crowding out. The sizes of the bubbles in the diagram indicate the magnitude of each county’s immigration impact index. Where the impact of immigration was the greatest (indicated by large bubbles), we find that both natives and immigrants had poured into the county. In all of the counties below the line, the immigration impact index is quite low (the bubble sizes are small). Only four counties below the line had an impact index greater than the average index of those above the line. These patterns suggest that the reason for the native outflow from the counties below the line was unlikely to have been due to a proportionately heavy foreign-born inflow. We conclude that the crowding-out mechanisms did not operate during the Age of Mass Migration in any general way. Instead, natives and immigrants were both moving to the same high-wage regions. These findings suggest that the immigrant arrivals were not reducing the wages of resident workers in this period.
An alternative model of immigration’s impact
As we noted, switching the focus to a period a century ago prompts us to adopt a dynamic perspective that we believe may resolve the contradiction between the elementary models of immigration which predict a decline in wages and the empirical studies that find little or no evidence for such an effect. The simple models assume that the only change in a labour market experiencing immigration is the exogenous outward shift of the labour supply curve. This assumption is systematically violated in the real world. It is scarcely an exaggeration to say that it is never the case. Immigrant entry not only responds to market conditions; it also stimulates market change.
We also suggest that it is impossible to imagine a plausible sequence of events in which immigrant entry occurs in isolation from other related changes. To take only the most obvious consequence, the arrival of newcomers will increase the demand for final products. Immigrants have to eat and find shelter and they can be counted on to purchase many other goods and services ranging from necessities to indulgences. But, when immigrants purchase these items, output will respond and thus the demand for labour will shift out. Because the shift in the labour supply curve inevitably is accompanied by a shift in the labour demand curve, it is extremely difficult to measure a “pure” wage impact of immigration on resident wages holding “other things equal.” The inherent technical and conceptual difficulties of this problem, heightened by the political implications of the results, are what make the issue of immigrant impacts so contested. We suggest that immigration is interesting and important precisely because of those features that make measurement of its wage impact problematic.
In addition to the labour demand shifts that occur pari passu with the arrival of immigrants, history suggests that immigrants are generally drawn to localities, occupations, and industries experiencing innovation, growth, and evolutionary change. In other words, they do not locate in stagnant textbook labour markets. Our first suggestion then is that immigrants differentially select destinations with high and/or growing wages. The reasons why this might be true are easy to understand. Immigrants have already made the decision to leave home; they select their final destinations using economic criteria. Indeed, immigrants’ selection of high wage cities was Goldin’s explanation for the positive correlation between the city wage and the foreign born share that she found about 1900 (Goldin 1994: 247).
Figure 5: Dynamic Economy Model
A simple expression of this possibility is depicted in Figure 5, which we label the “Dynamic Economy” model. We begin with the assumption that wages in all local labour markets are in equilibrium at the intersection of the original demand and original supply curve, the point shown by W0 and R0. We then let the labour demand curve in a selected city shift outward, perhaps reflecting a resource discovery. As a result, wages in that city might be expected to rise to Wh and resident employment to expand to Rh. However, since immigrants are mobile and attentive to economic rewards, they select the city with the dynamic economy over all others. When they do so, they cause the supply of labour curve to shift out (and become more elastic) at wages above W0. Employment expands from R0 toR1+M. Although the resulting wage rate, W1, is below the counterfactual wage Wh, it may nevertheless remain for some time above the initial level W0, and therefore above the wage in cities that did not experience the positive demand shock. Resident employment also expands from R0 to R1.
Figure 5 provides a framework for interpreting Goldin’s finding of a negative wage impact. When she reports, “wages were depressed in cities having an increase … [in their] foreign born” (emphasis added), she is referring to the difference between Wh and W1, not to a wage below W0. This subtlety is overlooked in many summaries of Goldin’s contribution. Reviews of Goldin reported by Hatton and Williamson (1998: 170), Dolmas and Huffman (2004: 1129), and Graham (2004: 60) suggest that immigrants depressed wages to a level below W0. This was not the case. Resident wages were high in cities with large numbers of immigrants.
The dynamic economy model assumes a demand shock unrelated to immigration. A second mechanism that would explain the failure of immigration to have a depressing impact on wages is an induced demand shift, that is, a shift in demand that responds to the arrival of immigrants. More foreigners or indeed more population from any source by itself should not mean lower wages or increased unemployment because the additional people not only supply labour but add to the demand for output in a closed economy. Even if we relax the textbook assumption of a closed economy and allow local labour markets to import goods from another region to meet the expanding demand, this induced demand story will still be valid. This is because some goods and services must be produced where they are consumed – restaurant meals, construction, and educational and medical services. In addition, an open economy will respond to an increase in its labour force by expanding production of tradable commodities in which it has a comparative advantage. Thus an exogenous entry of immigrants that produces an outward shift in the labour supply curve will prompt a positive response from the labour demand side of the market. It is also conceivable that, with an open economy, the impact of immigration may increase resident wages if the expansion of local industry pursuing a comparative advantage also allows those firms to exploit economies of scale (Romer 1996; Brezis and Krugman 1996) or if strong complementarities between immigrants and residents are at work (Ottaviano and Peri 2005).
Conclusion
The dynamic and open economy models imply that immigration does not harm resident workers in the common-sense way in which the term “harm” is generally understood. In the cases we examined, the wage either increases or remains the same and the employment of residents is not reduced. The empirical evidence from 100 years ago suggests that wages of residents increased and the local employment of residents increased in the presence of heavy immigration. The estimates reported by Goldin and by Hatton and Williamson of a wage setback for resident workers are only valid if we interpret them to suggest that resident wages would have risen even faster without immigration.9These authors, we think, would accept this interpretation of their findings. Such a counterfactual estimate is problematic for at least two reasons. If one is looking either for an explanation of political opposition to immigration in the past, as was Goldin or Williamson in an earlier article (1982), or if one is defending a proposal to restrict immigration in the present, what is likely to matter most is whether real wages fall in the presence of immigration not whether the growth of real wages is slowed (Williamson 1982: 256). Second, as articulated by Goldin and by Hatton and Williamson, the counterfactuals that they offer assume that there is no impact of immigration on the forward momentum of the economy. Yet, there is every reason to suppose that without immigration, wage growth, even in these high-wage cities, might have been slower or even halted. There is a broad consensus that immigration accelerated the rate of economic growth. The key mechanisms emphasized in the literature are:
- The high labour force participation rate of immigrants
- Immigration-induced capital flows from abroad
- High immigrant saving rates
- Increase in population-sensitive investment
- Economies of scale
- The roles of immigration in stimulating inventive activity and of population growth in accelerating the adoption of new technology
- The importation of significant stocks of human capital without cost to the American economy.
For a review of the literature see Carter and Sutch (1999: 319-332).
In a dynamic economy there is also a more direct connection between immigration and growth. The fact that immigrants opportunistically select local markets with the highest wages suggests that the ebb and flow of immigrants can act as a “governor” for the economy. By reducing the rate of wage growth, the local business boom can continue without being choked off by explosive wage growth (Carter and Sutch 1999: 338-339). Thus the fact that the wage does not reach the hypothetical level of Wh can be considered as good for the economy and as good for resident workers.